 E-submission
Indexed in:
Scopus, KCI, KoreaMed
Scopus, KCI, KoreaMed

Articles
- Page Path
- HOME > Ann Clin Nutr Metab > Volume 17(1); 2025 > Article
- Original Article Comparison of efficacy of enteral versus parenteral nutrition in patients after esophagectomy in Malaysia: a prospective cohort study
-
Ramizah Mohd Shariff1
 , Sze Chee Tee1, Shukri Jahit Mohammad1, Khei Choong Khong2
 -
Annals of Clinical Nutrition and Metabolism 2025;17(1):41-49.
DOI: https://doi.org/10.15747/ACNM.24.016
Published online: April 1, 2025
1Department of Surgery, National Cancer Institute, Putrajaya, Malaysia
2Department of Pharmacy, National Cancer Institute, Putrajaya, Malaysia
- Corresponding author: Ramizah Mohd Shariff, email: skyzlimit49@gmail.com
• Received: November 13, 2024 • Revised: November 23, 2024 • Accepted: December 24, 2024
© 2025 Korean Society of Surgical Metabolism and Nutrition · Korean Society for Parenteral and Enteral Nutrition · Asian Society of Surgical Metabolism and Nutrition · Japanese Society for Surgical Metabolism and Nutrition
This is an Open Access article distributed under the terms of the Creative Commons Attribution Non-Commercial License (http://creativecommons.org/licenses/by-nc/4.0), which permits unrestricted non-commercial use, distribution, and reproduction in any medium, provided the original work is properly cited.
- 7,500 Views
- 88 Download
- 1 Crossref
Abstract
-
Purpose This study aims to assess the effectiveness of enteral versus parenteral feeding in patients after esophagectomy.
-
Methods This a prospective cohort study of post-esophagectomy intensive care unit (ICU) patients over 12 months in the National Cancer Institute, Malaysia. Early enteral feeding followed the Enhanced Recovery After Surgery protocol, and parenteral nutrition (PN) was considered if there was a risk for conduit ischemia. It compared the effectiveness of enteral versus PN following esophagectomy, and assessed the correlations between biochemical nutritional markers and hospital lengths of stay or ventilation days.
-
Results It included two cohorts receiving PN (n=11) or enteral nutrition (EN) (n=11) following elective esophagectomy. Preoperative weight, body mass index, and Subjective Global Assessment were higher in the EN group (P=0.033, P=0.021, P=0.031, respectively). Nutritional interruption occurred more frequently in the EN group (63.7%) compared to the PN group (P=0.001). Mean levels of energy and protein received were 93.1 kcal/kg and 1.4 g/kg for PN versus 92.4 kcal/kg and 1.2 g/kg for EN (P=0.893 and P=0.036). The median lengths of ICU stay (P=0.688) and postoperative stay (P=0.947) between groups showed no significant difference. In addition, 30-day mortality (P=0.214) and other postoperative complications (P>0.05) were comparable in the two groups.
-
Conclusion Early initiation of supplementary PN due to significant interruption in EN led to higher protein intake compared to the EN group. However, there were no significant differences in postoperative outcomes, including 30-day mortality, ICU length of stay, and ventilation days. PN ensures adequate nutritional intake, especially in terms of protein delivery, without adversely affecting postoperative recovery and clinical outcomes.
Graphical abstract
Introduction
Malnutrition affects up to 78.9% of oesophageal cancer patients, leading to higher postoperative complications and mortality [1,2]. Nutritional support, particularly enteral nutrition (EN), is crucial for better outcomes due to its lower complication rates and costs compared to parenteral nutrition (PN) [3]. While early oral feeding post-esophagectomy may shorten hospital stays and improve recovery, concerns about anastomotic leaks remain [4].
In Asia, meta-analysis study in China by Peng et al. [5] found that only 37% of patients post-esophagectomy met nutritional goals via EN alone, necessitating supplemental PN. Another study in China by Yu et al. [6] reported greater infection rates in PN patients compared to those on EN after esophagectomy. It was noted that PN group exhibited higher, the rate of systemic inflammatory response than the EN group. Although EN group is generally preferred, PN is essential in certain situation where the gastrointestinal tract unable to support enteral feeding, lowering complications and aspiration risks in specific conditions [7].
Studies have compared the effectiveness of EN and PN in achieving nutritional goals after esophagectomy, with conflicting outcomes. Worthington et al. [8] noted that PN is essential when intestinal issues prevent adequate oral or EN and can reduce mortality. Fell et al. [9] found worse nutritional outcomes when PN is delayed in critically ill infants and children. Conversely, Mudge et al. [10] reported no significant differences in energy and protein delivery between EN and PN groups. These conflicting results may be due to variations in surgical techniques, postoperative care, and patient characteristics across centres.
A systematic review and meta-analysis by Chow et al. [11] found no significant differences in overall complication rates, anastomotic leaks, or respiratory complications between EN and PN groups. The researchers emphasize that there is no observed superiority between PN and EN regarding nutrition support complications, major adverse events, and mortality outcomes. A study by Weijs et al. [12] found no significant difference in hospital stay or ventilation days between the EN and PN groups. Martinez-Ortega et al. [13] recommend a combination of EN and PN if caloric and nutrient needs cannot be adequately met through oral and enteral means alone (less than 50% of the caloric requirement) after 7 days. In cases where nutrition therapy is necessary and EN is contraindicated, such as instances of intestinal obstruction, prompt initiation of PN is advised.
While not directly related to clinical outcomes, cost-effectiveness has also been compared [14]. Studies show EN to be more cost-efficient than PN due to lower costs of enteral feeding formulations and administration [15-17].
This study aims to compare the efficacy of EN and PN in Malaysian patients after esophagectomy by evaluating nutritional adequacy, complications, hospital stay length, and mechanical ventilation duration. Furthermore, correlation between length of stay (LOS) or ventilation duration and biochemical markers, including albumin and C-reactive protein (CRP) level, were analysed. These results will be basic data to guide optimal nutritional management in patients after esophagectomy.
Methods
Institutional review board approval was obtained from National Cancer Institute, Malaysia for this study (No. 800-5/3/1), and informed consent was provided by all participants.
It was a prospective cohort study and described according to the STROBE statement available at https://www.strobe-statement.org/.
This study was done at the intensive care unit (ICU) of the National Cancer Institute, Putrajaya, Malaysia, from May 31, 2023, to May 31, 2024. Early enteral tube feeding was initiated in all post-esophagectomy patients according to the Enhanced Recovery After Surgery protocol within 24 hours of surgery [12,18]. However, in cases with risk of conduit ischemia, PN will be initiated to ensure targeted calorie and protein provision by postoperative day 5.
The study included all patients who underwent esophagectomy and were admitted to the ICU postoperatively (Fig. 1).
The primary outcomes are calories and protein level of patient following esophagectomy postoperative day 5. The secondary outcomes are biochemical nutritional markers, complications, ICU and hospital lengths of stay, ventilation days, and overall postoperative complications according to Clavien-Dindo classification.
Demographic and clinical data were obtained from patients' medical records. Nutritional intake was monitored daily, with energy and protein intakes calculated using standard formulas. Complications were classified according to the Clavien-Dindo system [19,20].
There was no selection bias reportable.
Sample size estimation was not done since the entire target population was subjected to it.
Statistical analysis was conducted using IBM SPSS version 26 [21]. Continuous variables were reported as mean±standard deviation (SD) or median (interquartile range), while categorical variables were presented as frequency and percentage. The Student t-test or Mann-Whitney U test was used to compare continuous variables between the EN and PN groups, and the chi-square test or Fisher exact test was used for categorical variables. A P-value <0.05 was considered statistically significant [22-24].
Results
Participants’ sociodemographic characteristics are presented in Table 1. The mean ages were 60.9 years (PN) and 55.1 years (EN). The EN group had better preoperative weight, body mass index, and Subjective Global Assessment scores (P<0.05). Nutritional interruptions occurred more frequently in the EN group (63.7%), with seven patients converted to PN due to prolonged intestinal failure type I. Mean energy and protein intakes were similar between groups: PN (93.1 kcal/day, 1.4 g/kg) and EN (92.4 kcal/day, 1.2 g/kg) with P-values of 0.893 and 0.036, respectively. ICU and postoperative hospital stays, 30-day mortality, and postoperative complications did not differ significantly between groups.
Nutritional parameters and clinical outcomes between EN and PN groups are presented in Table 2. The caloric intake for both groups did not show significant differences across the days measured, as in Table 2. This pattern continued through day 7, where the mean caloric intake was 92.8 kcal (SD=11.35) for all patients, with no significant differences between groups (P=0.893). In contrast to caloric intake, total protein intake showed significant differences, particularly from day 2 onward. On day 2, the PN group had a mean protein intake of 0.9 g (SD=0.70) compared to 0.5 g (SD=0.25) for the EN group, with a significant P-value of 0.001. Levels of biochemical markers, specifically albumin and CRP, were also evaluated. While there were no significant differences in albumin levels across the days measured, value on day 3 (P=0.055) suggested a potential impact of nutritional strategy on protein status.
Postoperative complications of EN and PN groups measured according to the Clavien-Dindo system were presented in Table 3. The overall incidence of complications was similar between the EN and PN groups, with no significant differences in rates of complications (P=0.574), as in Table 3. The most common complications were of grade IIIb, occurring in 36.4% of all patients, with a higher rate in the PN group (45.4%) compared to the EN group (27.2%). As expected, the PN group experienced risk of conduit ischemia.
Albumin and CRP levels between pneumonia and non-pneumonia groups were presented in Table 4. Albumin levels did not show significant differences (P=0.302), whereas CRP levels were significantly higher in the pneumonia group (243.5 mg/L, SD=82.69) compared to the non-pneumonia group (137.4 mg/L, SD=96.58), with a P-value of 0.012, as in Table 4.
Correlation between LOS or ventilation duration and biochemical markers, including albumin and CRP level, were presented in Table 5. There is no significant correlation of LOS or ventilation days with albumin levels (P>0.05), as in Table 5.
Discussion
EN group had significantly better preoperative weight, body mass index, and Subjective Global Assessment scores but experienced more nutritional interruptions (63.7%) with seven conversions to PN. Both groups achieved similar energy intake, yet PN provided significantly higher protein intake from day 2 onward. ICU and hospital stays, 30-day mortality, and overall complications were comparable, except for a higher grade IIIb complication rate in PN. Elevated CRP levels were clearly associated with pneumonia and positively correlated with longer hospital stays.
Caloric intake trend continued through day 7, where the PN group maintained higher protein intake, indicating that PN may be more effective in meeting protein requirements in critically ill patients [25-29]. CRP levels did not differ significantly between groups, indicating similar inflammatory responses throughout the study period [12,29-31]. Fluid balance, as measured by median values and interquartile ranges, showed no significant differences between the groups, with P-values ranging from 0.061 to 0.577, suggesting comparable fluid management strategies.
Although there was no significant correlation between LOS or ventilation days with albumin level, a significant positive correlation was found between LOS and CRP levels (P=0.049), indicating that longer hospital stays are associated with higher inflammatory markers. This suggests that monitoring CRP levels may be crucial in managing patients' nutritional needs and overall recovery [32,33].
Even though the ICU guidelines highlight early enteral feeding in the ICU among the esophagectomy cohort, this can be difficult. The challenges in managing potential gut intolerance after major surgery position such patients at risk of not achieving targeted calorie and protein goals. Potential conduit ischemia is another issue that may hinder EN tolerance [24]. If there are no major issues after surgery, especially esophagectomy, EN is acceptable, as demonstrated herein; by day 7, the EN group had achieved 92.4% of the caloric target. The PN group achieved higher protein levels throughout the observation period, with significantly higher levels from day 2 (0.9 g/kg/day vs. 0.5 g/kg/day, P=0.001) through day 7 (1.4 g/kg/day vs. 1.2 g/kg/day, P=0.036). Complication rates were similar between groups, with Clavien-Dindo grade IIIb complications observed in 45.4% of PN patients versus 27.2% of EN patients (P>0.05). This aligns with previous findings on the safety of supplementary PN [34-36]. However, 63.6% of EN patients needed modifications to their feeding strategy, compared to none in the PN group (P=0.006), indicating that supplementary PN delivers nutrition more reliably [37].
The findings of this study also support key aspects of the European Society for Clinical Nutrition and Metabolism (ESPEN) guideline implementation especially in supplementary PN timing. Significant nutritional gaps in the first 3–5 days post-surgery validate ESPEN's recommendation for supplementary PN when EN provides <50% of nutritional needs by days 3–5. This shows the importance of early assessment of EN adequacy. By consistently evaluating whether patients are meeting their nutritional targets, healthcare providers can promptly identify those at risk of nutritional deficiencies. It also highlighted the importance of achieving the protein targets, which is a common issue among ICU patients receiving EN only [33,38-40].
It is important to adopt a flexible approach to nutritional support that is tailored to individual patient characteristics. Such an approach requires healthcare providers to consider a range of patient-specific factors, including age, underlying health conditions, treatment goals, and personal preferences. Such an individualized strategy ensures that nutritional interventions are effective and aligned with the patient's overall care plan. The implementation of these recommendations can significantly improve the quality of nutritional support provided to patients, fostering better clinical outcomes and enhancing the overall effectiveness of nutritional management in various healthcare settings. By prioritizing early assessments, focusing on protein delivery, monitoring inflammatory markers, and personalizing care, clinicians can make substantial strides in addressing the nutritional needs of their patients.
The study confirms that EN and PN are equally important for early nutritional support among ICU patients, especially those recovering from major surgery. There is no significant difference in outcomes with these two methods, but an early change to PN in patients who cannot tolerate EN will support achievement of calorie and protein targets for optimal recovery. Supplementary PN and/or conversion to total PN is acceptable for patients expected to not tolerate EN well. Both of these methods demonstrate the importance of focus on nutritional support with the aims of calorie and protein targets to support patient recovery.
The results of this study provide robust empirical support for the ESPEN guidelines, which advocate for the use of supplementary PN in post-esophagectomy patients within intensive care settings. While EN remains the preferred primary strategy, the data indicate that supplementary PN is crucial in enhancing nutritional intake, particularly in terms of protein, without increasing the risk of complications. By day 7, patients receiving PN consistently achieved higher protein intake than those in the EN group, further reinforcing the effect of ESPEN on early nutritional intervention and the critical significance of adequate protein levels for recovery [28,29].
Despite similar energy intake between the two groups, the superior protein delivery in the PN group underscores the necessity of supplementary PN when EN alone fails to meet nutritional targets. This finding is especially pertinent for patients who experience interruptions in EN or are at higher nutritional risk, as evidenced by the substantial percentage of EN patients who required a transition to PN during recovery.
The study also highlights the safety and efficacy of supplementary PN, with postoperative outcomes such as ICU stay, ventilation duration, and complication rates showing no significant differences between the groups. Furthermore, the correlation between elevated CRP levels and prolonged hospital stays suggests that effective nutritional support, including supplementary PN, may mitigate inflammatory responses and enhance recovery [18].
Integrating supplementary PN in accordance with ESPEN guidelines provides a reliable method to ensure comprehensive nutritional support during the early postoperative period following esophagectomy. By addressing the nutritional deficiencies that often occur with EN alone, clinicians can potentially improve patient outcomes, including reduced complications, expedited recovery times, and improved overall clinical results. These findings enhance the body of evidence supporting a flexible and individualized approach to postoperative nutrition, positioning supplementary PN as a valuable component of patient care after esophagectomy [27].
First, the relatively small sample size (n=22) may compromise the statistical power of the findings, potentially affecting the robustness of the conclusions. This limitation can hinder the generalizability of the results and is consistent with concerns raised in related studies. Furthermore, the non-randomized nature of the research introduces a risk of selection bias, which may affect the validity of the comparisons and outcomes. This issue has been acknowledged in previous research as well, emphasizing the need for caution when interpreting results derived from non-randomized designs. Additionally, the higher baseline nutritional risk observed in the PN group may confound the comparisons between groups. This variability in initial risk levels could potentially skew the outcome assessments, as noted in the literature. Such confounding factors must be addressed in future research to provide clearer insights into the efficacy of nutritional interventions.
Several avenues for future research emerge from these limitations. Large-scale, randomized controlled trials specifically focused on supplementary PN will be crucial. These studies would enhance statistical power and allow more definitive conclusions regarding the efficacy of PN in various clinical contexts. Second, the development of precise criteria for initiating supplementary PN is essential. Clear guidelines will help clinicians make informed decisions regarding patient nutrition, improving patient outcomes. Finally, further investigation into the optimal protein-to-energy ratios in supplementary PN formulations is warranted. Understanding the ideal nutritional composition can significantly impact patient recovery and overall health. By exploring these areas, future research can contribute to a more nuanced understanding of nutritional support and its role in clinical practice, ultimately leading to improved patient care.
An unexpected detail is the high calorie intake (up to 93 kcal/kg/day by day 7), which is unusually high compared to typical ICU targets (25–30 kcal/kg/day). This may reflect aggressive nutritional support in this cohort, potentially due to increased metabolic demands post-esophagectomy. The significant correlation between CRP and LOS adds a new layer, suggesting that inflammation management could be key to reducing hospital stays.
While EN remains the preferred initial approach, supplementary PN proves essential when EN falls short, particularly in achieving protein targets without increasing complications. It also reveals no significant differences between EN and PN groups in hospital stay, ventilation duration, or complication rates. These findings advocate for a flexible, patient-tailored nutritional strategy that aligns with ESPEN guidelines to optimize outcomes and emphasize the need for early nutritional assessment.
Authors’ contribution
Conceptualization: all authors. Data curation; Formal analysis: RMS, KCK. Project administration: all authors. Funding acquisition: Not applicable. Writing – original draft: RMS. Writing – review & editing: TSC, MSJ. All authors read and approved the final manuscript.
Conflict of interest
The authors of this manuscript have no conflicts of interest to disclose.
Funding
None.
Data availability
Contact the corresponding author for data availability.
Acknowledgments
We sincerely thank the intensive care unit staff and the surgical team for their unwavering support and cooperation throughout the duration of this study. Additionally, we extend our gratitude to the patients and their families for their participation and valuable contributions.
Supplementary materials
None.
Fig. 1.

Comparison enteral nutrition (EN) versus parenteral nutrition (PN) on clinical outcome in esophagectomy patients. POD, postoperative day; ICU, intensive care unit; LOS, length of stay.

Table 1.
Sociodemographic characteristic comparison between PN and EN groups
PN, parenteral nutrition; EN, enteral nutrition; SD, standard deviation; ASA, American Society of Anesthesiologists; ECOG, Eastern Cooperative Oncology Group; SGA, Subjective Global Assessment; BMI, body mass index; ICU, intensive care unit; IQR, interquartile range; SSI, surgical site infection.
aIndependent t-test was applied, significant P-value was set at 0.05.
bChi-square test was applied, significant P-value was set at 0.05.
cFisher test was applied, significant P-value was set at 0.05.
Table 2.
Comparison of nutritional parameters and clinical PN and EN groups
Table 3.
Postoperative complications (Clavien-Dindo system)
Table 4.
Comparison of albumin and CRP levels between pneumonia and non-pneumonia groups
| Biochemical parameter | Mean±SD | t-test (df) | P-valuea | |
|---|---|---|---|---|
| Non-pneumonia (n=10) | Pneumonia (n=12) | |||
| Albumin (g/L) | 27.8±2.62 | 29.2±3.30 | –1.06 (20) | 0.302 |
| CRP (mg/L) | 137.4±96.58 | 243.5±82.69 | –2.77 (20) | 0.012 |
Table 5.
Correlations of LOS, ventilation duration, and biochemical markers with albumin and CRP
| Correlation | Correlation coefficient | P-valuea |
|---|---|---|
| LOS vs. albumin | –0.256 | 0.250 |
| LOS vs. CRP | 0.424 | 0.049 |
| Ventilation days vs. albumin | –0.190 | 0.397 |
| Ventilation days vs. CRP | 0.276 | 0.213 |
- 1. Riccardi D, Allen K. Nutritional management of patients with esophageal and esophagogastric junction cancer. Cancer Control 1999;6:64-72. ArticlePubMedPDF
- 2. Mulazzani GE, Corti F, Della Valle S, Di Bartolomeo M. Nutritional support indications in gastroesophageal cancer patients: from perioperative to palliative systemic therapy: a comprehensive review of the last decade. Nutrients 2021;13:2766.ArticlePubMedPMC
- 3. Berkelmans GH, van Workum F, Weijs TJ, Nieuwenhuijzen GA, Ruurda JP, Kouwenhoven EA, et al. The feeding route after esophagectomy: a review of literature. J Thorac Dis 2017;9(Suppl 8):S785-91. ArticlePubMedPMC
- 4. Zheng R, Devin CL, Pucci MJ, Berger AC, Rosato EL, Palazzo F. Optimal timing and route of nutritional support after esophagectomy: a review of the literature. World J Gastroenterol 2019;25:4427-36. ArticlePubMedPMC
- 5. Peng J, Cai J, Niu ZX, Chen LQ. Early enteral nutrition compared with parenteral nutrition for esophageal cancer patients after esophagectomy: a meta-analysis. Dis Esophagus 2016;29:333-41. ArticlePubMed
- 6. Yu HM, Tang CW, Feng WM, Chen QQ, Xu YQ, Bao Y. Early enteral nutrition versus parenteral nutrition after resection of esophageal cancer: a retrospective analysis. Indian J Surg 2017;79:13-8. ArticlePubMedPMCPDF
- 7. Jeejeebhoy KN. Enteral nutrition versus parenteral nutrition: the risks and benefits. Nat Clin Pract Gastroenterol Hepatol 2007;4:260-5. ArticlePubMedPDF
- 8. Worthington P, Balint J, Bechtold M, Bingham A, Chan LN, Durfee S, et al. When is parenteral nutrition appropriate? JPEN J Parenter Enteral Nutr 2017;41:324-77. ArticlePubMedPDF
- 9. Fell DM, Bitetto EA, Skillman HE. Timing of enteral nutrition and parenteral nutrition in the PICU. Nutr Clin Pract 2023;38 Suppl 2:S174-212. ArticlePubMed
- 10. Mudge L, Isenring E, Jamieson GG. Immunonutrition in patients undergoing esophageal cancer resection. Dis Esophagus 2011;24:160-5. ArticlePubMed
- 11. Chow R, Bruera E, Chiu L, Chow S, Chiu N, Lam H, et al. Enteral and parenteral nutrition in cancer patients: a systematic review and meta-analysis. Ann Palliat Med 2016;5:30-41. PubMed
- 12. Weijs TJ, Berkelmans GH, Nieuwenhuijzen GA, Ruurda JP, van Hillegersberg R, Soeters PB, et al. Routes for early enteral nutrition after esophagectomy: a systematic review. Clin Nutr 2015;34:1-6. ArticlePubMed
- 13. Martinez-Ortega AJ, Pinar-Gutierrez A, Serrano-Aguayo P, Gonzalez-Navarro I, Remon-Ruiz PJ, Pereira-Cunill JL, et al. Perioperative nutritional support: a review of current literature. Nutrients 2022;14:1601.ArticlePubMedPMC
- 14. Rinninella E, Persiani R, D'Ugo D, Pennestrì F, Cicchetti A, Di Brino E, et al. NutriCatt protocol in the Enhanced Recovery After Surgery (ERAS) program for colorectal surgery: the nutritional support improves clinical and cost-effectiveness outcomes. Nutrition 2018;50:74-81. ArticlePubMed
- 15. Braunschweig CL, Levy P, Sheean PM, Wang X. Enteral compared with parenteral nutrition: a meta-analysis. Am J Clin Nutr 2001;74:534-42. ArticlePubMed
- 16. Sadique Z, Harrison DA, Bear DE, Rowan KM, Grieve R; CALORIES Trial Investigators. Effectiveness and cost-effectiveness of early nutritional support via the parenteral versus the enteral route for critically ill adult patients. J Crit Care 2019;52:237-41. ArticlePubMed
- 17. Stratton RJ, Elia M. A review of reviews: a new look at the evidence for oral nutritional supplements in clinical practice. Clin Nutr Suppl 2007;2:5-23. Article
- 18. Weimann A, Braga M, Carli F, Higashiguchi T, Hubner M, Klek S, et al. ESPEN guideline: clinical nutrition in surgery. Clin Nutr 2017;36:623-50. ArticlePubMed
- 19. Nederlof N, de Jonge J, de Vringer T, Tran TC, Spaander MC, Tilanus HW, et al. Does routine endoscopy or contrast swallow study after esophagectomy and gastric tube reconstruction change patient management? J Gastrointest Surg 2017;21:251-8. ArticlePubMedPMCPDF
- 20. Dindo D, Demartines N, Clavien PA. Classification of surgical complications: a new proposal with evaluation in a cohort of 6336 patients and results of a survey. Ann Surg 2004;240:205-13. PubMedPMC
- 21. Mehta CR, Patel NR. IBM SPSS exact tests. IBM Corporation; 2011.
- 22. Altman DG. Practical statistics for medical research. Chapman and Hall/CRC; 1990.
- 23. Bland JM, Altman DG. Multiple significance tests: the Bonferroni method. BMJ 1995;310:170.ArticlePubMedPMC
- 24. Chandanos E, Lagergren J. The mystery of male dominance in oesophageal cancer and the potential protective role of oestrogen. Eur J Cancer 2009;45:3149-55. ArticlePubMed
- 25. Kutsogiannis J, Alberda C, Gramlich L, Cahill NE, Wang M, Day AG, et al. Early use of supplemental parenteral nutrition in critically ill patients: results of an international multicenter observational study. Crit Care Med 2011;39:2691-9. ArticlePubMed
- 26. Elke G, van Zanten AR, Lemieux M, McCall M, Jeejeebhoy KN, Kott M, et al. Enteral versus parenteral nutrition in critically ill patients: an updated systematic review and meta-analysis of randomized controlled trials. Crit Care 2016;20:117.ArticlePubMedPMC
- 27. Singer P, Blaser AR, Berger MM, Alhazzani W, Calder PC, Casaer MP, et al. ESPEN guideline on clinical nutrition in the intensive care unit. Clin Nutr 2019;38:48-79. ArticlePubMed
- 28. Berger MM, Reintam-Blaser A, Calder PC, Casaer M, Hiesmayr MJ, Mayer K, et al. Monitoring nutrition in the ICU. Clin Nutr 2019;38:584-93. ArticlePubMed
- 29. Doig GS, Simpson F, Sweetman EA, Finfer SR, Cooper DJ, Heighes PT, et al. Early parenteral nutrition in critically ill patients with short-term relative contraindications to early enteral nutrition: a randomized controlled trial. JAMA 2013;309:2130-8. ArticlePubMed
- 30. Wang WP, Yan XL, Ni YF, Guo K, Ke CK, Cheng QS, et al. Effects of lipid emulsions in parenteral nutrition of esophageal cancer surgical patients receiving enteral nutrition: a comparative analysis. Nutrients 2013;6:111-23. ArticlePubMedPMC
- 31. Clyne B, Olshaker JS. The C-reactive protein. J Emerg Med 1999;17:1019-25. ArticlePubMed
- 32. Pokharel N, Katwal G, Adhikari SK. Comparison of preoperative nutritional risk index and body mass index for predicting immediate postoperative outcomes following major gastrointestinal surgery: cohort-study. Ann Med Surg (Lond) 2019;48:53-8. ArticlePubMedPMC
- 33. Pontiroli AE, Loreggian L, Rovati MP, De Patto E, Folini L, Raveglia F, et al. Length of hospitalization is associated with selected biomarkers (albumin and lymphocytes) and with co-morbidities: study on 4000 patients. Biomark Res 2017;5:13.ArticlePubMedPMCPDF
- 34. Lightdale J, Valim C, Newburg A, Heard L, Zgleszewski S, Fox V. Patient ratings by endoscopy unit providers using the American Society of Anesthesiologists (ASA) physical status classification scale: 122. J Pediatr Gastroenterol Nutr 2005;41:530-1. Article
- 35. Fietkau R, Lewitzki V, Kuhnt T, Holscher T, Hess CF, Berger B, et al. A disease-specific enteral nutrition formula improves nutritional status and functional performance in patients with head and neck and esophageal cancer undergoing chemoradiotherapy: results of a randomized, controlled, multicenter trial. Cancer 2013;119:3343-53. ArticlePubMed
- 36. Deftereos I, Kiss N, Isenring E, Carter VM, Yeung JM. A systematic review of the effect of preoperative nutrition support on nutritional status and treatment outcomes in upper gastrointestinal cancer resection. Eur J Surg Oncol 2020;46:1423-34. ArticlePubMed
- 37. Reignier J, Boisrame-Helms J, Brisard L, Lascarrou JB, Ait Hssain A, Anguel N, et al. Enteral versus parenteral early nutrition in ventilated adults with shock: a randomised, controlled, multicentre, open-label, parallel-group study (NUTRIREA-2). Lancet 2018;391:133-43. PubMed
- 38. Ishii K, Tsubosa Y, Niihara M, Akai T, Soneda W. Changes in the nutritional status of elderly patients after esophagectomy. Esophagus 2019;16:408-12. ArticlePubMedPMCPDF
- 39. Kuzu MA, Terzioglu H, Genc V, Erkek AB, Ozban M, Sonyurek P, et al. Preoperative nutritional risk assessment in predicting postoperative outcome in patients undergoing major surgery. World J Surg 2006;30:378-90. ArticlePubMedPDF
- 40. Takesue T, Takeuchi H, Ogura M, Fukuda K, Nakamura R, Takahashi T, et al. A prospective randomized trial of enteral nutrition after thoracoscopic esophagectomy for esophageal cancer. Ann Surg Oncol 2015;22 Suppl 3:S802-9. ArticlePubMedPDF
References
Figure & Data
REFERENCES
Citations
Citations to this article as recorded by 
- Optimizing nutritional support in upper gastrointestinal surgery: A comprehensive review of feeding jejunostomy techniques and outcomes
Ioana Alexandra Prisacariu, Konstantinos Eleftherios Koumarelas, Konstantinos Argyriou, Alexandros Charalabopoulos, Grigorios Christodoulidis
World Journal of Gastrointestinal Surgery.2025;[Epub] CrossRef
 Cite
Cite- Figure
-
- Related articles
-
- Association of soy oil-based lipid injectable emulsion with early body weight loss after minimally invasive esophagectomy in Japan: a retrospective cohort study
- The enteral feeding tube access route in esophageal cancer surgery in Japan: a retrospective cohort study
- Impact of postoperative nutritional status on the patients’ clinical outcomes and knee biomechanics following total knee arthroplasty in Japan: a prospective cohort study
Comparison of efficacy of enteral versus parenteral nutrition in patients after esophagectomy in Malaysia: a prospective cohort study
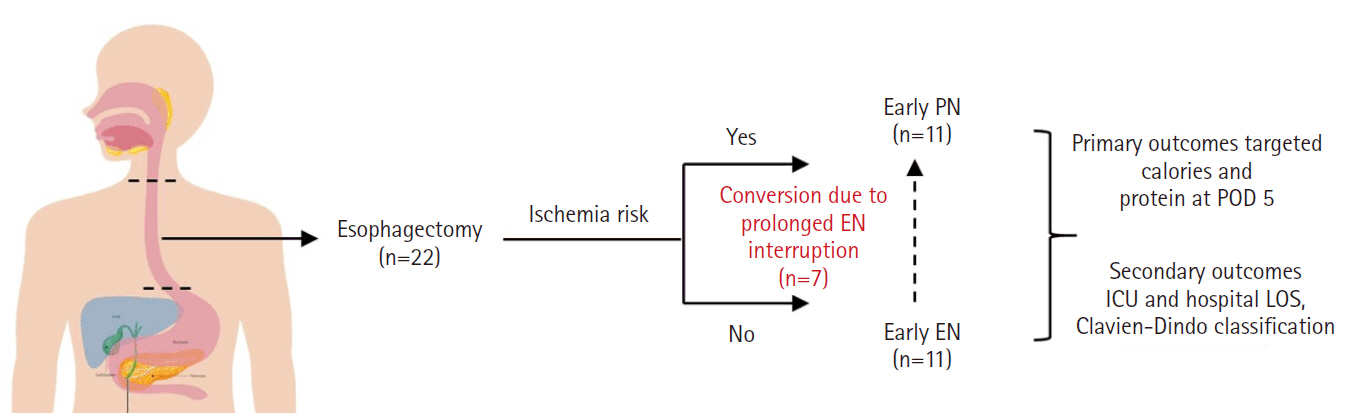
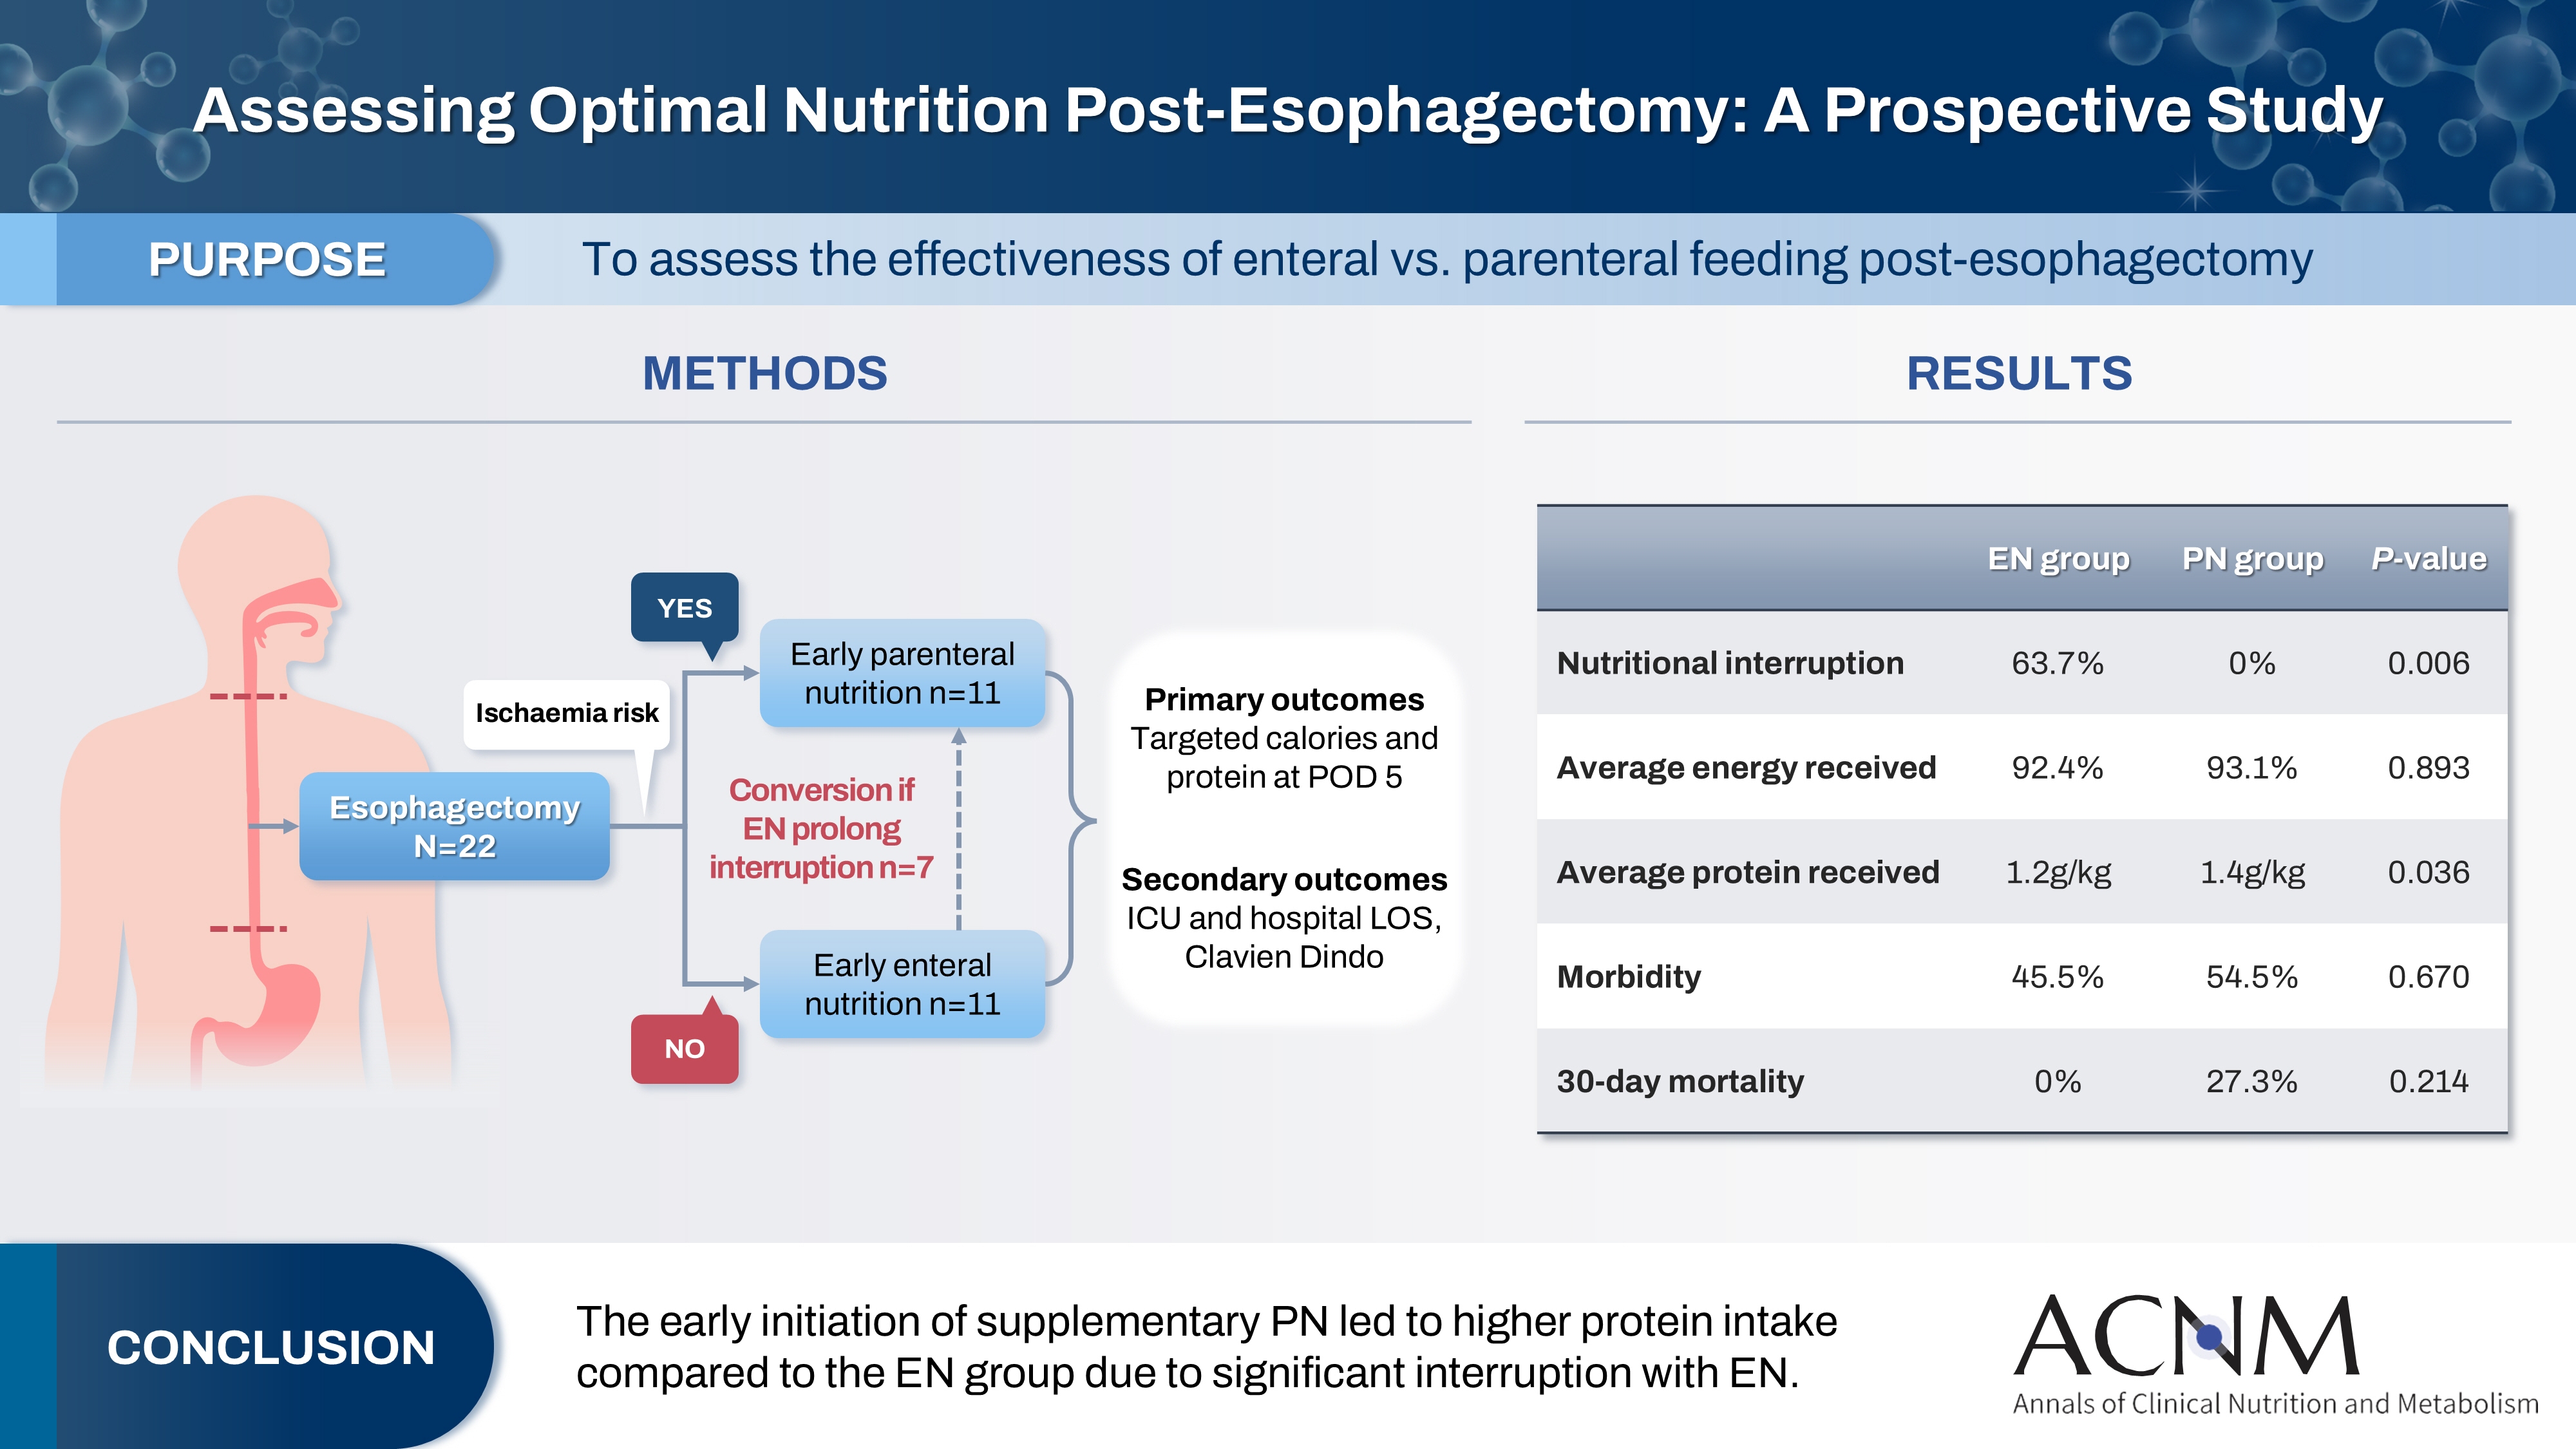
Fig. 1. Comparison enteral nutrition (EN) versus parenteral nutrition (PN) on clinical outcome in esophagectomy patients. POD, postoperative day; ICU, intensive care unit; LOS, length of stay.
Graphical abstract
Fig. 1.
Graphical abstract
Comparison of efficacy of enteral versus parenteral nutrition in patients after esophagectomy in Malaysia: a prospective cohort study
| Characteristic | All (n=22) | PN (n=11) | EN (n=11) | P-value |
|---|---|---|---|---|
| Age (yr), mean±SD | 58.0±12.79 | 60.9±10.63 | 55.1±14.55 | 0.297a |
| Sex, No. (%) | 0.647b | |||
| Male | 15 (68.2) | 7 (63.6) | 8 (72.7) | |
| Female | 7 (31.8) | 4 (36.4) | 3 (27.3) | |
| ASA, No. (%) | 0.540b | |||
| I | 7 (31.8) | 3 (27.3) | 4 (36.4) | |
| II | 11 (50.0) | 5 (45.5) | 6 (54.5) | |
| III | 4 (18.2) | 3 (27.3) | 1 (9.1) | |
| ECOG, No. (%) | 0.078b | |||
| 0 | 12 (54.5) | 4 (36.4) | 8 (72.7) | |
| 1 | 9 (40.9) | 7 (63.6) | 2 (18.2) | |
| 2 | 1 (4.5) | 0 | 1 (9.1) | |
| SGA, No. (%) | 0.031b | |||
| A | 10 (45.4) | 2 (18.2) | 8 (72.7) | |
| B | 6 (27.3) | 5 (45.5) | 1 (9.1) | |
| C | 6 (27.3) | 4 (36.4) | 2 (18.2) | |
| Stage, No. (%) | 0.189b | |||
| II | 2 (9.1) | 0 | 2 (18.2) | |
| III | 14 (63.7) | 9 (81.8) | 5 (45.5) | |
| III | 1 (4.5) | 0 (0.0) | 1 (9.1) | |
| IV | 1 (4.5) | 1 (9.1) | 0 | |
| NA | 4 (18.2) | 1 (9.1) | 2 (27.3) | |
| Weight (kg), mean±SD | 62.1±12.33 | 56.6±10.88 | 67.8±11.60 | 0.033a |
| BMI (kg/m2), mean±SD | 23.3±3.97 | 21.4±2.73 | 25.2±4.21 | 0.021a |
| ICU stay (day), median (IQR) | 3.0 (2.00–9.50) | 3.0 (2.00–14.00) | 2.00 (2.00–5.00) | 0.688c |
| Hospital stay (day), median (IQR) | 29.0 (15.00–43.50) | 30.0 (15.00–41.00) | 20.0 (15.00–61.00) | 0.947c |
| Postoperative complication, No. (%) | ||||
| 30-day mortality | 3 (13.6) | 3 (27.3) | 0 | 0.214c |
| Morbidity | 11 (50.0) | 6 (54.5) | 5 (45.5) | 0.670b |
| Pneumonia | 12 (54.5) | 6 (54.5) | 6 (54.5) | >0.999c |
| Prolonged ventilation | 1 (4.5) | 0 | 1 (9.1) | >0.999c |
| Re-admission to ICU | 7 (31.8) | 3 (27.3) | 4 (36.4) | >0.999c |
| SSI | 1 (4.5) | 1 (9.1) | 0 | >0.999c |
| Change in strategy, No. (%) | ||||
| Interruption and change of feeding route | - | 0 | 7 (63.7) | 0.001b |
| Characteristic | All (n=22) | PN (n=11) | EN (n=11) | P-valuea |
|---|---|---|---|---|
| Calorie and protein targets in ICU | ||||
| Calorie intake (kcal/kg), mean±SD | ||||
| D1 | 29.9±18.70 | 33.5±15.53 | 26.2±21.56 | 0.379 |
| D2 | 41.9±13.00 | 45.7±9.34 | 38.1±15.35 | 0.174 |
| D3 | 54.0±12.97 | 56.6±14.10 | 51.5±11.82 | 0.362 |
| D5 | 77.9±17.08 | 82.1±12.79 | 73.7±20.27 | 0.261 |
| D7 | 92.8±11.35 | 93.1±8.86 | 92.4±14.10 | 0.893 |
| Total protein (g/kg), mean±SD | ||||
| D1 | 0.5±0.35 | 0.6±0.38 | 0.4±0.37 | 0.121 |
| D2 | 0.7±0.31 | 0.9±0.70 | 0.5±0.25 | 0.001 |
| D3 | 0.9±0.31 | 1.0±0.27 | 0.7±0.26 | 0.008 |
| D5 | 1.1±0.29 | 1.3±0.28 | 1.0±0.24 | 0.034 |
| D7 | 1.3±0.21 | 1.4±0.20 | 1.2±0.18 | 0.036 |
| Biochemical parameters | ||||
| Albumin (g/L), mean±SD | ||||
| D1 | 29.2±4.03 | 28.4±4.50 | 30.1±3.51 | 0.327 |
| D3 | 27.0±3.48 | 25.5±3.01 | 28.4±3.47 | 0.055 |
| D5 | 28.5±3.02 | 28.1±2.17 | 29.0±3.74 | 0.494 |
| D7 | 28.9±5.31 | 27.3±3.90 | 30.5±6.17 | 0.153 |
| CRP (mg/L), mean±SD | ||||
| D1 | 102.3±59.37 | 121.5±70.2 | 83.2±40.66 | 0.134 |
| D3 | 200.0±102.22 | 221.7±108.40 | 178.3±95.67 | 0.331 |
| D5 | 195.3±102.48 | 225.2±66.61 | 165.4±125.09 | 0.182 |
| D7 | 163.0±98.52 | 182.0±70.83 | 144.0±120.70 | 0.380 |
| Fluid balance (mL), median (IQR) | ||||
| D1 | 1,438 (854.3 to 1,961) | 997.0 (566.0 to1,948) | 1,599 (1,200 to 2,000) | 0.158 |
| D3 | 439.5 (–218.0 to 798.5) | 292.0 (–199.0 to 576.0) | 742.0 (–674.0 to 830.0) | 0.577 |
| D5 | 354.0 (–56.0 to 605.5) | 580.0 (–8.0 to 900.0) | 67.0 (–74.0 to 400.0) | 0.061 |
| D7 | 338.0 (–30.3 to 761.5) | 520.0 (194.0 to 859.0) | 190.0 (–46.0 to 729.0) | 0.375b |
| Grade | No. (%) | P-value | ||
|---|---|---|---|---|
| All (n=22) | PN (n=11) | EN (n=11) | ||
| 0 | 8 (36.4) | 4 (36.4) | 4 (36.4) | 0.574 |
| I | 0 | 0 | 0 | |
| II | 3 (13.7) | 1 (9.1) | 2 (18.2) | |
| IIIa | 1 (4.5) | 0 | 1 (9.1) | |
| IIIb | 8 (36.4) | 5 (45.4) | 3 (27.2) | |
| IVb | 1 (4.5) | 0 | 1 (9.1) | |
| V | 1 (4.5) | 1 (9.1) | 0 | |
| Biochemical parameter | Mean±SD | t-test (df) | P-valuea | |
|---|---|---|---|---|
| Non-pneumonia (n=10) | Pneumonia (n=12) | |||
| Albumin (g/L) | 27.8±2.62 | 29.2±3.30 | –1.06 (20) | 0.302 |
| CRP (mg/L) | 137.4±96.58 | 243.5±82.69 | –2.77 (20) | 0.012 |
| Correlation | Correlation coefficient | P-valuea |
|---|---|---|
| LOS vs. albumin | –0.256 | 0.250 |
| LOS vs. CRP | 0.424 | 0.049 |
| Ventilation days vs. albumin | –0.190 | 0.397 |
| Ventilation days vs. CRP | 0.276 | 0.213 |
Table 1. Sociodemographic characteristic comparison between PN and EN groups
PN, parenteral nutrition; EN, enteral nutrition; SD, standard deviation; ASA, American Society of Anesthesiologists; ECOG, Eastern Cooperative Oncology Group; SGA, Subjective Global Assessment; BMI, body mass index; ICU, intensive care unit; IQR, interquartile range; SSI, surgical site infection. Independent t-test was applied, significant P-value was set at 0.05. Chi-square test was applied, significant P-value was set at 0.05. Fisher test was applied, significant P-value was set at 0.05.
Table 2. Comparison of nutritional parameters and clinical PN and EN groups
PN, parenteral nutrition; EN, enteral nutrition; ICU, intensive care unit; SD, standard deviation; CRP, C-reactive protein; IQR, interquartile range. Independent t-test, significant P-value was set at 0.05. Mann Whitney U test was applied, significant P-value was set at 0.05.
Table 3. Postoperative complications (Clavien-Dindo system)
PN, parenteral nutrition; EN, enteral nutrition.
Table 4. Comparison of albumin and CRP levels between pneumonia and non-pneumonia groups
CRP, C-reactive protein; SD, standard deviation; df, degree of freedom. Independent t-test was applied, significant P-value was set at 0.05.
Table 5. Correlations of LOS, ventilation duration, and biochemical markers with albumin and CRP
LOS, length of stay; CRP, C-reactive protein. Pearson correlation was applied, significant P-value was set at 0.05.

