 E-submission
Indexed in:
Scopus, KCI, KoreaMed
Scopus, KCI, KoreaMed

Articles
- Page Path
- HOME > Ann Clin Nutr Metab > Volume 17(2); 2025 > Article
- Original Article Evaluation of the modified Nutrition Risk in Critically Ill score in Korean critically ill patients with COVID-19: a retrospective cohort study
-
Won Ho Han1,2
 , Jong-Mog Lee1,3, Jae Hoon Lee1,2, Hyun Mi Lee1, Ji-Yeon Kim1, Mok Young Jang1, Sung-Sik Han1,4
 -
Annals of Clinical Nutrition and Metabolism 2025;17(2):125-131.
DOI: https://doi.org/10.15747/ACNM.25.0009
Published online: August 1, 2025
1Nutrition Support Team, National Cancer Center, Goyang, Korea
2Critical Care Medicine, National Cancer Center, Goyang, Korea
3Center for Lung Cancer, National Cancer Center, Goyang, Korea
4Center for Liver and Pancreatobiliary Cancer, National Cancer Center, Goyang, Korea
- Corresponding author: Sung-Sik Han email: sshan@ncc.re.kr
• Received: April 4, 2025 • Revised: July 20, 2025 • Accepted: July 21, 2025
© 2025 The Korean Society of Surgical Metabolism and Nutrition · The Korean Society for Parenteral and Enteral Nutrition · Asian Society of Surgical Metabolism and Nutrition
This is an Open Access article distributed under the terms of the Creative Commons Attribution Non-Commercial License (http://creativecommons.org/licenses/by-nc/4.0), which permits unrestricted non-commercial use, distribution, and reproduction in any medium, provided the original work is properly cited.
- 4,179 Views
- 38 Download
Abstract
-
Purpose We evaluated the efficacy of the modified Nutrition Risk in Critically Ill (mNUTRIC) score for malnutrition screening and its association with mortality in intensive care unit (ICU) patients with COVID-19.
-
Methods The nutritional status of 129 COVID-19 ICU patients admitted between February 2021 and May 2022 was assessed using American Society for Parenteral and Enteral Nutrition/Academy of Nutrition and Dietetics (ASPEN/AND) criteria. The sensitivity, specificity, and clinical correlations of the mNUTRIC score were analyzed.
-
Results Of the 129 patients, 35 (27.1%) met the ASPEN/AND malnutrition criteria. Multivariable analysis identified the mNUTRIC score, underlying malignancy, and mechanical ventilation as significant factors associated with malnutrition. The mNUTRIC score had a sensitivity of 77.1% and specificity of 63.8% (area under the curve [AUC], 0.71; 95% confidence interval [CI], 0.62–0.79) for diagnosing malnutrition, improving to 88.6% and 80.9%, respectively, after adjusting for malignancy and ventilation (AUC, 0.89; 95% CI, 0.82–0.95). Patients with a low mNUTRIC score had a mortality rate of 2.9% and a median ICU stay of 7.7 days (range, 0–84.2 days), whereas those with a high score (≥5) had a mortality rate of 13.1% and a median ICU stay of 10.2 days (range, 1.4–88.5 days) (P=0.046 and P=0.011, respectively).
-
Conclusion The mNUTRIC score is an effective screening tool for malnutrition in ICU patients with COVID-19, especially those with malignancy or requiring mechanical ventilation, and is strongly associated with mortality and length of ICU stay.
Introduction
Patients admitted to the intensive care unit (ICU) frequently experience a prolonged systemic inflammatory response due to various infections, often accompanied by sepsis or multiple organ failure. These patients require a range of treatments, including mechanical ventilation, sedatives, and neuromuscular blocking agents. Both their underlying condition and the extended duration of ICU treatment are recognized risk factors for developing malnutrition and sarcopenia [1,2]. Furthermore, the emergence of severe COVID-19 pneumonia has underscored the significance of nutritional support as a prognostic factor during the management of severe cases of COVID-19 [3,4].
Several studies have explored screening tools for adequate nutrition support [5-7]. However, many of these tools depend on information obtained from patient interviews, such as recent dietary changes and weight loss or gain. In actual clinical practice, particularly when admitting patients to the ICU with severe COVID-19 pneumonia, it is often challenging to gather this information reliably [8]. Therefore, there is a pressing need for a faster and more practical tool to assess nutritional status.
The Nutrition Risk in Critically Ill (NUTRIC) score offers a rapid and straightforward method for screening malnutrition by evaluating patients at ICU admission. It incorporates variables such as age, Acute Physiology and Chronic Health Evaluation (APACHE) II score, Sequential Organ Failure Assessment (SOFA) score, and the presence of comorbidities. Although the original NUTRIC score requires measurement of interleukin-6 (IL-6), this is often impractical in routine ICU settings. As a result, the modified NUTRIC (mNUTRIC) score, which excludes IL-6, is now widely utilized [9-11].
This study aimed to investigate the clinical utility of the mNUTRIC score as a nutrition screening tool in critically ill patients with COVID-19 pneumonia, as well as its association with clinical outcomes.
Methods
Between February 2021 and May 2022, all patients admitted to the ICU with COVID-19 pneumonia were included in the study. Patients who were discharged from the ICU within 48 hours, or who were admitted solely for isolation or close observation, were excluded.
Patients were managed in a negative-pressure ICU in accordance with institutional COVID-19 protocols. Treatment protocols included the use of remdesivir, corticosteroids, and prone positioning when indicated. Standard ICU equipment and care pathways were followed, encompassing sedation, mechanical ventilation, continuous renal replacement therapy, and extracorporeal membrane oxygenation (ECMO) as appropriate.
After ICU admission, the attending physician assessed each patient. If the patient was at high risk for malnutrition, such as those with difficulty maintaining an oral diet or with a prior history of hospitalization, they were referred to the nutrition support team (NST). The NST evaluated nutritional status according to the American Society for Parenteral and Enteral Nutrition/Academy of Nutrition and Dietetics (ASPEN/AND) criteria (Supplement 1) [2].
The mNUTRIC score was calculated based on the patient's age, the SOFA score within 24 hours of ICU admission, and the APACHE II score. The sensitivity and specificity of the mNUTRIC score were evaluated with respect to malnutrition status as determined by the ASPEN/AND criteria. Additionally, to analyze clinical outcomes in relation to the mNUTRIC score, patients were divided into two groups: a low mNUTRIC score group (score <5) and a high mNUTRIC score group (score ≥5). We then compared ICU mortality and length of ICU stay between these groups.
This study was approved by the Institutional Review Board of National Cancer Center (approval no. NCC 2022-0307). Due to its retrospective design, the requirement for informed consent was waived by the IRB.
Continuous variables are presented as mean±standard deviation for normally distributed data, and as median with interquartile range (IQR) for data not following a normal distribution. Categorical variables were compared using the chi-square test or the Fisher exact test, as appropriate. Continuous variables between two groups were analyzed using either the Student t test or the Mann-Whitney U test, depending on data normality.
To evaluate the diagnostic performance of the mNUTRIC score, receiver operating characteristic curve analysis was performed, and the area under the curve (AUC) was calculated. To assess whether the classification performance of the mNUTRIC score improved with adjustment, a logistic regression model including malignancy and mechanical ventilation (each as dichotomous variables) was constructed, and the AUC was recalculated based on the multivariable model.
Variables with a P-value <0.1 in univariable analysis or of recognized clinical relevance were included as candidates for multivariable logistic regression. Backward stepwise logistic regression was used for variable selection. Multicollinearity among the retained variables was assessed using variance inflation factors (VIFs), with variables showing a VIF >5 excluded from the final model. The Youden index was used to determine the optimal cutoff point for the mNUTRIC score in identifying malnutrition.
All statistical analyses were performed using R version 4.2.2 (R Foundation for Statistical Computing).
Results
Among the 129 patients included in the study, 35 (27.1%) were identified as malnourished according to the ASPEN/AND criteria. Comparison between groups revealed that the no-malnutrition group had a significantly higher body mass index (BMI; 25.0±4.2 kg/m2 vs. 22.8±3.9 kg/m2, P=0.006), while the malnutrition group showed a greater proportion of patients with underlying malignancy (51.4% vs. 24.5%, P=0.003). Additionally, at ICU admission, the malnutrition group had significantly higher APACHE II, SOFA, and mNUTRIC scores compared to the no-malnutrition group. Regarding ICU outcomes, the malnutrition group experienced a significantly longer ICU stay (13.0 days [IQR, 2.4–88.5] vs. 7.5 days [IQR 2.4–84.2], P<0.001) and a higher mortality rate (20.0% vs. 3.2%, P=0.004) (Table 1).
Backward stepwise logistic regression removed age, BMI, albumin, and C-reactive protein from the model due to lack of statistical significance. VIF analysis of the remaining variables showed that APACHE II and SOFA scores had high multicollinearity with the mNUTRIC score and were therefore excluded. As a result, the final model included mNUTRIC score, underlying malignancy, and mechanical ventilation as independent predictors of malnutrition. Multivariable analysis identified the mNUTRIC score (odds ratio [OR], 3.88; 95% confidence interval [CI], 1.39–10.82; P=0.01), underlying malignancy (OR, 7.55; 95% CI, 2.21–25.77; P=0.001), and mechanical ventilation (OR, 16.43; 95% CI, 4.93–54.72; P<0.001) as statistically significant predictors (Table 2).
The mNUTRIC score showed a sensitivity of 77.1% and a specificity of 63.8% for diagnosing malnutrition (AUC, 0.71) (Fig. 1, Supplement 2). When adjusted for the presence of malignancy and mechanical ventilation, sensitivity and specificity improved to 88.6% and 80.9%, respectively (AUC, 0.89; 95% CI, 0.82–0.95) (Fig. 2).
Assessment of the association between mNUTRIC score and ICU outcomes demonstrated that patients with a low mNUTRIC score had a mortality rate of 2.9% and a median ICU stay of 7.7 days (range, 0–84.2 days). In contrast, those with a high mNUTRIC score (≥5) had a mortality rate of 13.1% and a median ICU stay of 10.2 days (range, 1.4–88.5 days); both differences were statistically significant (P=0.046 and P=0.011, respectively) (Table 3). Youden index analysis confirmed that a score of 5 was the optimal cutoff value for predicting malnutrition using the mNUTRIC score.
Discussion
This study demonstrated the utility of the mNUTRIC score as a screening tool for malnutrition in ICU patients diagnosed with COVID-19, showing a significant association with clinical outcomes, including ICU length of stay and mortality. Notably, the diagnostic performance of the score was further improved when adjusting for malignancy and ventilator care variables. Previous studies evaluating the mNUTRIC score in ICU populations have reported comparable performance in nutritional assessment, and this study similarly affirms the value of the mNUTRIC score in this context [11,12].
Various nutritional assessment tools have been investigated for diagnosing malnutrition in critically ill patients. However, most widely used nutrition assessment tools in current practice require patient or caregiver interviews and depend on variables such as reduced food intake and weight loss [4-6]. Additionally, assessment methods such as the ASPEN/AND criteria and the Patient-Generated Subjective Global Assessment necessitate a physical examination to evaluate parameters including fat mass and muscle function [2,13]. In severe COVID-19 patients, conducting interviews or performing physical examinations is particularly challenging due to the need for infection control and the frequent use of sedatives during ventilator care or ECMO for acute respiratory distress syndrome caused by COVID-19 [14,15]. The mNUTRIC score provides a simple screening method for assessing nutritional status using fundamental patient data (such as age, pre-ICU admission duration, and comorbidities) along with measurements collected at admission, including the APACHE and SOFA scores. Thus, the use of mNUTRIC may help overcome limitations related to traditional patient assessments in the unique context of COVID-19, serving as a practical alternative for nutritional screening.
In this study, we observed improved diagnostic performance of the mNUTRIC score after adjusting for underlying cancer and variables related to ventilator therapy, indicating that both factors are closely associated with malnutrition. Prior studies have reported that malnutrition is common among critically ill cancer patients and is linked to prolonged mechanical ventilation and increased ICU mortality [16,17]. Nutritional risk has also been shown to correlate with the duration of mechanical ventilation and adverse outcomes in patients with hematological malignancies. It is well established that malignancy can lead to functional decline and cachexia, both of which are strongly associated with malnutrition [18,19]. Additionally, cancer-related treatments, including surgical interventions and anticancer therapies, are known contributors to malnutrition [20]. Second, mechanical ventilator care not only leads to respiratory muscle weakness but also induces a bedridden state, contributing to sarcopenia [21]. Furthermore, the administration of sedatives and neuromuscular blocking agents during ventilator care in COVID-19 patients is recognized as an additional risk factor for sarcopenia [22].
This study has several limitations. It was conducted at a single institution with a relatively small cohort and was retrospective in design. Moreover, the mNUTRIC score does not include direct indicators of nutritional status, such as weight, muscle mass, or muscle function. Therefore, further research is warranted to explore the relationship between the mNUTRIC score and comprehensive measures of nutritional status.
In conclusion, among ICU patients with COVID-19 and underlying malignancy and/or requiring mechanical ventilation, the mNUTRIC score demonstrated clear utility as a malnutrition screening tool. The mNUTRIC score showed strong correlations with clinical outcomes, including ICU mortality and length of stay.
Authors’ contribution
Conceptualization: SSH. Data curation: WHH. Formal analysis: JHL. Investigation: JML, SSH. Supervision: SSH. Writing–original draft: WHH, JHL, SSH. Writing–review & editing: HML, JYK, MYJ, JML. All authors read and approved the final manuscript.
Conflict of interest
The authors of this manuscript have no conflicts of interest to disclose.
Funding
This work was supported by a grant (NCC 2310350-3) from the National Cancer Center, Republic of Korea.
Data availability
Contact the corresponding author for research data availability.
Acknowledgments
None.
Supplementary materials
Supplementary materials can be found via https://doi.org/10.15747/ACNM.25.0009
Fig. 1.
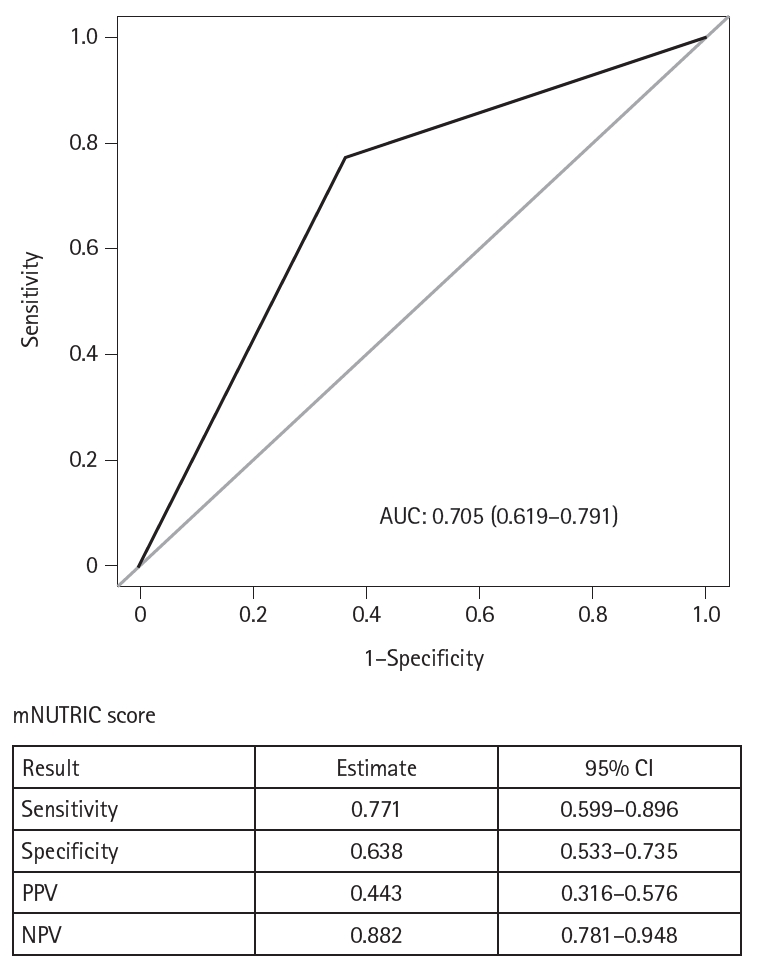
ROC curve for the mNUTRIC score. ROC, receiver operating characteristic; AUC, area under the ROC curve; mNUTRIC score, modified Nutrition Risk in Critically Ill score; CI, confidence interval; PPV, positive predictive value; NPV, negative predictive value.
Fig. 2.
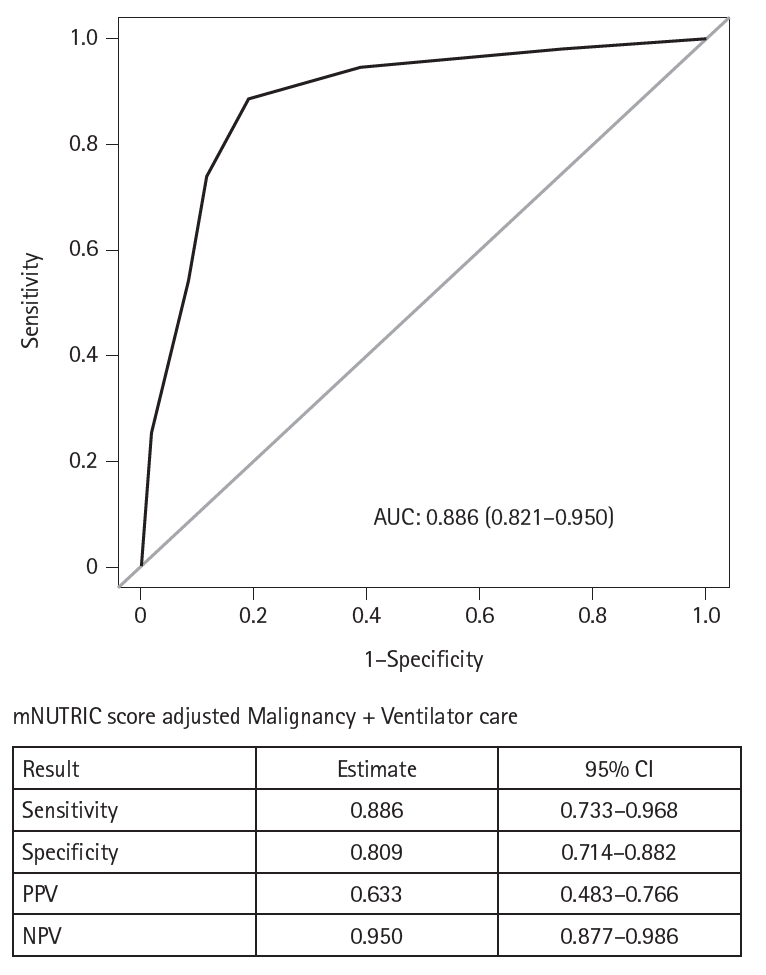
ROC curve for the mNUTRIC score when adjusted for malignancy and mechanical ventilation. ROC, receiver operating characteristic; AUC, area under the ROC curve; mNUTRIC score; modified Nutrition Risk in Critically Ill score; CI, confidence interval; PPV, positive predictive value; NPV, negative predictive value.
Table 1.
Patient characteristics
Values are presented as number (%), mean±SD, or median (IQR).
BMI, body mass index; DM, diabetes mellitus; HTN, hypertension; COPD, chronic obstructive pulmonary disease; CVA, cerebrovascular accident; APACHE II, Acute Physiology and Chronic Health Evaluation II; SOFA, Sequential Organ Failure Assessment; mNUTRIC score, modified Nutrition Risk in Critically Ill score; CRP, C-reactive protein; CRRT, continuous renal replacement therapy; ECMO, extracorporeal membrane oxygenation; ICU, intensive care unit; IQR, interquartile range.
aChi-square test.
bt-test.
cFisher exact test.
dWilcoxon rank sum test.
Table 2.
Multivariable analysis of factors associated with malnutrition
OR, odds ratio; CI, confidence interval; BMI, body mass index; DM, diabetes mellitus; HTN, hypertension; COPD, chronic obstructive pulmonary disease; CVA, cerebrovascular accident; APACHE II, Acute Physiology and Chronic Health Evaluation II; SOFA, Sequential Organ Failure Assessment; mNUTRIC score, modified Nutrition Risk in Critically Ill score; CRP, C-reactive protein; CRRT, continuous renal replacement therapy; ECMO, extracorporeal membrane oxygenation; ICU, intensive care unit.
Table 3.
Clinical outcomes according to mNUTRIC scores
- 1. Singer P, Blaser AR, Berger MM, Alhazzani W, Calder PC, Casaer MP, et al. ESPEN guideline on clinical nutrition in the intensive care unit. Clin Nutr 2019;38:48-79. ArticlePubMed
- 2. McClave SA, Taylor BE, Martindale RG, Warren MM, Johnson DR, Braunschweig C, et al. Guidelines for the provision and assessment of nutrition support therapy in the adult critically ill patient: Society of Critical Care Medicine (SCCM) and American Society for Parenteral and Enteral Nutrition (A.S.P.E.N.). JPEN J Parenter Enteral Nutr 2016;40:159-211. PubMed
- 3. Wang PY, Li Y, Wang Q. Sarcopenia: an underlying treatment target during the COVID-19 pandemic. Nutrition 2021;84:111104.ArticlePubMedPMC
- 4. Wierdsma NJ, Kruizenga HM, Konings LA, Krebbers D, Jorissen JR, Joosten MI, et al. Poor nutritional status, risk of sarcopenia and nutrition related complaints are prevalent in COVID-19 patients during and after hospital admission. Clin Nutr ESPEN 2021;43:369-76. ArticlePubMedPMC
- 5. Kondrup J, Rasmussen HH, Hamberg O, Stanga Z. Nutritional risk screening (NRS 2002): a new method based on an analysis of controlled clinical trials. Clin Nutr 2003;22:321-36. ArticlePubMed
- 6. Stratton RJ, Hackston A, Longmore D, Dixon R, Price S, Stroud M, et al. Malnutrition in hospital outpatients and inpatients: prevalence, concurrent validity and ease of use of the ‘malnutrition universal screening tool’ (‘MUST’) for adults. Br J Nutr 2004;92:799-808. ArticlePubMed
- 7. Arabi YM, Preiser JC. A critical view on primary and secondary outcome measures in nutrition trials. Intensive Care Med 2017;43:1875-7. ArticlePubMedPDF
- 8. Gelfman DM. Will the traditional physical examination be another casualty of COVID-19? Am J Med 2021;134:299-300. ArticlePubMedPMC
- 9. Heyland DK, Dhaliwal R, Jiang X, Day AG. Identifying critically ill patients who benefit the most from nutrition therapy: the development and initial validation of a novel risk assessment tool. Crit Care 2011;15:R268.ArticlePubMedPMCPDF
- 10. Rahman A, Hasan RM, Agarwala R, Martin C, Day AG, Heyland DK, et al. Identifying critically-ill patients who will benefit most from nutritional therapy: further validation of the “modified NUTRIC” nutritional risk assessment tool. Clin Nutr 2016;35:158-62. ArticlePubMed
- 11. Mukhopadhyay A, Henry J, Ong V, Leong CS, Teh AL, van Dam RM, et al. Association of modified NUTRIC score with 28-day mortality in critically ill patients. Clin Nutr 2017;36:1143-8. ArticlePubMed
- 12. de Vries MC, Koekkoek WK, Opdam MH, van Blokland D, van Zanten AR. Nutritional assessment of critically ill patients: validation of the modified NUTRIC score. Eur J Clin Nutr 2018;72:428-35. ArticlePubMedPMCPDF
- 13. Bauer J, Capra S, Ferguson M. Use of the scored Patient-Generated Subjective Global Assessment (PG-SGA) as a nutrition assessment tool in patients with cancer. Eur J Clin Nutr 2002;56:779-85. ArticlePubMedPDF
- 14. Hanidziar D, Bittner EA. Sedation of mechanically ventilated COVID-19 patients: challenges and special considerations. Anesth Analg 2020;131:e40-1. ArticlePubMedPMC
- 15. Flinspach AN, Booke H, Zacharowski K, Balaban U, Herrmann E, Adam EH, et al. High sedation needs of critically ill COVID-19 ARDS patients: a monocentric observational study. PLoS One 2021;16:e0253778.ArticlePubMedPMC
- 16. Kundu R, Seeger R, Elfassy MD, Rozenberg D, Ahluwalia N, Detsky ME, et al. The association between nutritional risk index and ICU outcomes across hematologic malignancy patients with acute respiratory failure. Ann Hematol 2023;102:439-45. ArticlePubMedPDF
- 17. Shpata V, Prendushi X, Kreka M, Kola I, Kurti F, Ohri I, et al. Malnutrition at the time of surgery affects negatively the clinical outcome of critically ill patients with gastrointestinal cancer. Med Arch 2014;68:263-7. ArticlePubMedPMC
- 18. Henry L. Effect of malnutrition on cancer patients. In: Shaw C, ed. Nutrition and cancer. Blackwell Publishing Ltd.; 2010. p. 45-82.
- 19. Berardi G, Antonelli G, Colasanti M, Meniconi R, Guglielmo N, Laurenzi A, et al. Association of sarcopenia and body composition with short-term outcomes after liver resection for malignant tumors. JAMA Surg 2020;155:e203336.ArticlePubMedPMC
- 20. Wang H, Yang R, Xu J, Fang K, Abdelrahim M, Chang L, et al. Sarcopenia as a predictor of postoperative risk of complications, mortality and length of stay following gastrointestinal oncological surgery. Ann R Coll Surg Engl 2021;103:630-7. ArticlePubMedPMC
- 21. Fogarty MJ, Mantilla CB, Sieck GC. Impact of sarcopenia on diaphragm muscle fatigue. Exp Physiol 2019;104:1090-9. ArticlePubMedPMCPDF
- 22. Woo HY, Oh SY, Lee H, Ryu HG. Evaluation of the association between decreased skeletal muscle mass and extubation failure after long-term mechanical ventilation. Clin Nutr 2020;39:2764-70. ArticlePubMed
References
Figure & Data
REFERENCES
Citations
Citations to this article as recorded by 
 Cite
CiteEvaluation of the modified Nutrition Risk in Critically Ill score in Korean critically ill patients with COVID-19: a retrospective cohort study


Fig. 1. ROC curve for the mNUTRIC score. ROC, receiver operating characteristic; AUC, area under the ROC curve; mNUTRIC score, modified Nutrition Risk in Critically Ill score; CI, confidence interval; PPV, positive predictive value; NPV, negative predictive value.
Fig. 2. ROC curve for the mNUTRIC score when adjusted for malignancy and mechanical ventilation. ROC, receiver operating characteristic; AUC, area under the ROC curve; mNUTRIC score; modified Nutrition Risk in Critically Ill score; CI, confidence interval; PPV, positive predictive value; NPV, negative predictive value.
Fig. 1.
Fig. 2.
Evaluation of the modified Nutrition Risk in Critically Ill score in Korean critically ill patients with COVID-19: a retrospective cohort study
| Variables | No malnutrition (n=94) | Malnutrition (n=35) | P-value |
|---|---|---|---|
| Sex | |||
| Male | 52 (55.3) | 17 (48.6) | 0.494a |
| Female | 42 (44.7) | 18 (51.4) | |
| Age (yr) | 63.0±13.0 | 67.7±11.8 | 0.066b |
| BMI (kg/m2) | 25.0±4.2 | 22.8±3.9 | 0.006b |
| Underlying disease | |||
| DM | 23 (24.5) | 14 (40.0) | 0.082a |
| HTN | 46 (48.9) | 20 (57.1) | 0.407a |
| COPD | 5 (5.3) | 1 (2.9) | >0.999c |
| CVA | 12 (12.8) | 6 (17.1) | 0.571c |
| Malignancy | 23 (24.5) | 18 (51.4) | 0.003a |
| Nutrition route | <0.001a | ||
| No nutritional support | 62 (66.0) | 2 (5.7) | |
| Enteral feeding | 12 (12.8) | 24 (68.6) | |
| Parenteral | 20 (21.3) | 9 (25.7) | |
| APACHE II | 25 (12–34) | 27 (13–50) | 0.006d |
| SOFA | 1 (0–7) | 2 (0–10) | 0.002d |
| mNUTRIC score | 4 (1–7) | 6 (3–8) | <0.001d |
| Initial laboratory tests | |||
| Albumin (g/dL) | 3.3±0.6 | 3.0±0.4 | 0.005b |
| CRP (mg/dL) | 8.2±6.0 | 11.8±7.7 | 0.008b |
| Ventilator care | 15 (16.0) | 24 (68.6) | <0.001a |
| CRRT | 2 (2.1) | 8 (22.9) | <0.001c |
| ECMO | 4 (4.3) | 4 (11.4) | 0.211c |
| ICU length of stay (day) | 7.5 (2.0–84.2) | 13.0 (2.4–88.5) | <0.001d |
| Outcome | 0.004c | ||
| Survival | 91 (96.8) | 28 (80.0) | |
| Mortality | 3 (3.2) | 7 (20.0) |
| Variable | Univariable analysis | Multivariable analysis | |||
|---|---|---|---|---|---|
| OR (95% CI) | P-value | OR (95% CI) | P-value | ||
| Sex | Male | Ref | |||
| Female | 1.31 (0.60–2.85) | 0.495 | |||
| Age | 1.03 (0.99–1.06) | 0.069 | |||
| BMI | 0.87 (0.79–0.96) | 0.009 | |||
| Underlying disease | |||||
| DM | No | Ref | |||
| Yes | 2.05 (0.90–4.69) | 0.086 | |||
| HTN | No | Ref | |||
| Yes | 1.39 (0.63–3.04) | 0.408 | |||
| COPD | No | Ref | |||
| Yes | 0.52 (0.05–4.64) | 0.561 | |||
| CVA | No | Ref | |||
| Yes | 1.41 (0.48–4.11) | 0.525 | |||
| Malignancy | No | Ref | Ref | ||
| Yes | 3.26 (1.45–7.36) | 0.004 | 7.55 (2.21–25.77) | 0.001 | |
| APACHE II | 1.13 (1.04–1.23) | 0.003 | |||
| SOFA | 1.52 (1.19–1.94) | 0.001 | |||
| mNUTRIC score | Low | Ref | Ref | ||
| High | 5.95 (2.43–14.56) | <0.001 | 3.88 (1.39–10.82) | 0.010 | |
| Initial laboratory tests | |||||
| Albumin | 0.34 (0.14–0.86) | 0.023 | |||
| CRP | 1.08 (1.01–1.14) | 0.010 | |||
| Ventilator care | No | Ref | Ref | ||
| Yes | 11.48 (4.66–28.32) | <0.001 | 16.43 (4.93–54.72) | <0.001 | |
| CRRT | No | Ref | |||
| Yes | 13.62 (2.73–68.00) | 0.002 | |||
| ECMO | No | Ref | |||
| Yes | 2.90 (0.68–12.31) | 0.148 | |||
| ICU length of stay | 1.04 (1.01–1.07) | 0.004 | |||
| Variable | Low mNUTRIC score (<5) | High mNUTRIC score (≥5) | P-value |
|---|---|---|---|
| Mortality | 2 (2.9) | 8 (13.1) | 0.046a |
| ICU length of stay | 7.7 (0–84.2) | 10.2 (1.4–88.5) | 0.011b |
| Ventilator care | 12 (17.6) | 27 (44.3) | 0.001a |
| ECMO | 3 (4.4) | 5 (8.2) | 0.475c |
Table 1. Patient characteristics
Values are presented as number (%), mean±SD, or median (IQR). BMI, body mass index; DM, diabetes mellitus; HTN, hypertension; COPD, chronic obstructive pulmonary disease; CVA, cerebrovascular accident; APACHE II, Acute Physiology and Chronic Health Evaluation II; SOFA, Sequential Organ Failure Assessment; mNUTRIC score, modified Nutrition Risk in Critically Ill score; CRP, C-reactive protein; CRRT, continuous renal replacement therapy; ECMO, extracorporeal membrane oxygenation; ICU, intensive care unit; IQR, interquartile range. aChi-square test. bt-test. cFisher exact test. dWilcoxon rank sum test.
Table 2. Multivariable analysis of factors associated with malnutrition
OR, odds ratio; CI, confidence interval; BMI, body mass index; DM, diabetes mellitus; HTN, hypertension; COPD, chronic obstructive pulmonary disease; CVA, cerebrovascular accident; APACHE II, Acute Physiology and Chronic Health Evaluation II; SOFA, Sequential Organ Failure Assessment; mNUTRIC score, modified Nutrition Risk in Critically Ill score; CRP, C-reactive protein; CRRT, continuous renal replacement therapy; ECMO, extracorporeal membrane oxygenation; ICU, intensive care unit.
Table 3. Clinical outcomes according to mNUTRIC scores
Values are presented as number (%) or median (range). mNUTRIC score, modified Nutrition Risk in Critically Ill score; ICU, intensive care unit; ECMO, extracorporeal membrane oxygenation. aChi-square test. bWilcoxon rank sum test. cFisher exact test.

