 E-submission
Indexed in:
Scopus, KCI, KoreaMed
Scopus, KCI, KoreaMed

Articles
- Page Path
- HOME > Ann Clin Nutr Metab > Volume 17(2); 2025 > Article
- Original Article Peripheral vein infusions of amino acids prevent early postoperative weight loss after robot-assisted radical transmediastinal esophagectomy: a retrospective study in Japan
-
Tomonori Narita1,2
 , Kazuhiko Fukatsu2,3, Satoshi Murakoshi2,3,4, Reo Inoue3, Kenichi Kono3, Midori Noguchi3, Nana Matsumoto2, Shoh Yajima1, Koichi Yagi1, Yoshifumi Baba1
 -
Annals of Clinical Nutrition and Metabolism 2025;17(2):149-155.
DOI: https://doi.org/10.15747/ACNM.25.0012
Published online: August 1, 2025
1Department of Gastrointestinal Surgery, Graduate School of Medicine, The University of Tokyo, Tokyo, Japan
2Operating Room Management and Surgical Metabolism, Graduate School of Medicine, The University of Tokyo, Tokyo, Japan
3Surgical Center, The University of Tokyo Hospital, Tokyo, Japan
4Faculty of Health and Social Work, School of Nutrition and Dietetics, The Kanagawa University of Human Services, Kanagawa, Japan
- Corresponding author: Kazuhiko Fukatsu email: fukatsu-1su@h.u-tokyo.ac.jp
• Received: April 20, 2025 • Revised: June 21, 2025 • Accepted: June 26, 2025
© 2025 The Korean Society of Surgical Metabolism and Nutrition · The Korean Society for Parenteral and Enteral Nutrition · Asian Society of Surgical Metabolism and Nutrition
This is an Open Access article distributed under the terms of the Creative Commons Attribution Non-Commercial License (http://creativecommons.org/licenses/by-nc/4.0), which permits unrestricted non-commercial use, distribution, and reproduction in any medium, provided the original work is properly cited.
- 2,023 Views
- 25 Download
Abstract
-
Purpose Postoperative body weight loss (PBWL) is linked to poor long-term outcomes following esophagectomy for esophageal cancer, making perioperative nutrition critically important. Although minimally invasive procedures such as robot-assisted radical transmediastinal esophagectomy (RA-TME) have become more prevalent, less attention has been paid to perioperative nutritional management. This study evaluates the impact of intravenous (IV) amino acid infusions on PBWL in patients undergoing RA-TME.
-
Methods We retrospectively analyzed 155 patients who underwent RA-TME for esophageal or esophagogastric junction cancer at our hospital between 2011 and 2022. Patients were divided into two groups: AA(+) (n=73, received IV amino acids between postoperative days 1–6) and AA(–) (n=82, did not receive IV amino acids). Oral or enteral nutrition was withheld until postoperative day 6. We compared nutrient intake, postoperative outcomes, and nutritional status between groups.
-
Results Patient backgrounds, surgical outcomes, and complication rates were similar in both groups. However, the AA(+) group received significantly greater energy and nutrient intake. PBWL at 2 weeks post-surgery was significantly lower in the AA(+) group than in the AA(–) group (6.50% vs. 8.15%, P=0.0091).
-
Conclusion IV amino acid infusion may help mitigate early PBWL after RA-TME.
Graphical abstract
Introduction
Esophageal cancer ranks as the 10th most common malignancy and is associated with the 6th poorest prognosis among all cancers worldwide [1]. Multidisciplinary approaches, including surgery, radiation therapy, and chemotherapy, are essential for managing esophageal cancer. Among these options, esophagectomy remains the standard treatment. However, this procedure carries a substantial risk of postoperative body weight loss (PBWL), severe complications, and hospital mortality. Notably, severe PBWL is associated with poor long-term outcomes after esophagectomy [2-4]. Multiple strategies have been pursued to reduce the surgical impact of esophagectomy, such as the adoption of minimally invasive techniques, maintaining optimal nutritional status, and implementing enhanced postoperative recovery protocols. In the present study, we investigated the influence of parenteral nutrition (PN) containing amino acids on postoperative morbidity and PBWL.
We developed the robot-assisted radical transmediastinal esophagectomy (RA-TME), a nontransthoracic esophagectomy with radical mediastinal lymphadenectomy. This procedure combines a robotic transhiatal approach with a video-assisted cervical approach to minimize surgical trauma, and it has been used at our institution since 2011. Our previous studies have demonstrated that the RA-TME group experiences shorter postoperative hospital stays and lower rates of postoperative pneumonia compared to patients who undergo conventional transthoracic esophagectomy [5]. RA-TME has also been associated with improved postoperative quality of life relative to transthoracic esophagectomy [6]. Patients without complications after RA-TME are typically discharged around postoperative day (POD) 17. Since the adoption of RA-TME, however, our focus on perioperative nutritional therapy appears to have waned. We only insert a jejunostomy catheter intraoperatively for early enteral nutrition (EN) in patients who are in very poor general condition or are older than 80 years. It remains unclear whether patients undergoing this minimally invasive procedure benefit from rigorous postoperative nutritional management, such as early EN, balanced PN, or nutritional counseling.
Methods
Between January 2011 and December 2022, we enrolled patients who underwent RA-TME with gastric conduit reconstruction for esophageal or esophagogastric junctional cancer at our hospital and who received neither oral nutrition nor EN prior to POD 6. Patients with residual tumors after surgery were excluded from the present study. This study was approved by the Ethics Committee of the University of Tokyo Hospital (approval No. 3962). Written informed consent was waived by the IRB because of the study’s retrospective design.
RA-TME with 2- or 3-field lymphadenectomy was performed in three stages, with all patients in the supine position [7]. During the first stage, lymph node dissections in the cervical and abdominal fields were carried out simultaneously by two surgical teams. The cervical procedure was performed via a collar incision under mediastinoscopic guidance, while the abdominal procedure was accomplished using a laparoscopic approach. In the second stage, a robotic surgical system, either the da Vinci S or Xi (Intuitive Surgical), was used to perform the transhiatal robotic procedure through the abdominal ports. The cervical procedure via collar incision and the da Vinci procedure via the transhiatal approach were used to free the entire esophagus and dissected mediastinal lymph nodes from adhesions and attachments. Upon completion of mediastinal dissection, the da Vinci S or Xi robotic system was removed from the surgical field. The final stage included the retrieval of surgical specimens, reconstruction with a gastric tube conduit, and cervical anastomosis.
Oral intake was initiated at approximately POD 7. Until this time point, patients received only intravenous (IV) infusions. The composition of these infusions, including whether they contained amino acids or lipid injectable emulsions, was determined by the attending physicians.
We retrospectively assessed patient characteristics, surgical and nutritional details, and postoperative outcomes at three time points: 1 week (POD 6–8), 2 weeks (POD 12–16), and 4 weeks (POD 25–35) after surgery. Data were extracted from our institutional database and electronic medical records. Patient background parameters included age, sex, height, body weight, body mass index, body composition, American Society of Anesthesiologists physical status, and hematological findings. Pathological findings were classified according to the 8th edition of the TNM classification by the Union for International Cancer Control [8]. The severity of postoperative complications was assessed using the Clavien-Dindo classification [9]. Details of postoperative nutrition were calculated based on prescribed IV infusions as well as the types and amounts of hospital food provided.
All continuous variables are presented as median values. Statistical analyses were performed using the Mann-Whitney U test, Student t-test, and either the chi-square test or Fisher exact test, as appropriate. Changes in body weight, body composition, and hematological parameters over time were analyzed using linear mixed-effects models. A P-value of <0.05 was considered statistically significant. All statistical analyses were conducted using JMP Pro 17 (SAS Institute Japan Ltd) for Windows.
Results
Fig. 1 presents the flowchart of patient enrollment. In total, 262 patients underwent RA-TME for esophageal or esophagogastric junctional cancer at our hospital between 2011 and 2022. Of these, we reviewed 155 patients who received only IV infusions prior to POD 6, with no oral nutrition or EN. Patients were categorized into the AA(+) group (n=73), who received IV amino acid infusions at least once between surgery and POD 6, and the AA(–) group (n=82), who did not receive amino acids during this period.
Table 1 summarizes the patients’ preoperative characteristics. There were significant differences in skeletal muscle index, which was higher in the AA(–) group than in the AA(+) group, and in the neutrophil-to-lymphocyte ratio, which was lower in the AA(–) group compared to the AA(+) group.
A significantly larger proportion of the AA(+) group underwent two-field lymph node dissections, excluding cervical field dissections, compared to the AA(–) group. No significant differences were observed between groups in intraoperative parameters, such as operative time, intraoperative blood loss, or reconstruction route (Table 2).
Postoperative nutritional intake data are shown in Table 3. Total energy, protein, fat, and carbohydrate intake on POD 6, from POD 1 to 6, and from POD 1 to 14, were all significantly higher in the AA(+) group than in the AA(–) group. The IV fluid volume at all observed time points did not differ significantly between groups.
Postoperative outcomes are shown in Table 4. There were no significant differences in postoperative complications, length of hospital stay, or pathological outcomes between the two groups. The levels of γ-glutamyl transpeptidase were significantly higher in the AA(+) group than in the AA(–) group throughout the postoperative observation period (weeks 1–4) (Supplement 1).
Postoperative PBWL and the proportion of patients experiencing marked body weight changes at 2 weeks were both significantly lower in the AA(+) group compared to the AA(–) group (Fig. 2). However, body composition parameters, including muscle mass and body fat percentage at 4 weeks, did not differ significantly between the two groups (Table 5).
Discussion
We evaluated the influence of parenteral administration of amino acids after RA-TME on postoperative outcomes and found that amino acid administration was associated with reduced PBWL.
PBWL has been reported to correlate with poor long-term outcomes after esophagectomy for esophageal cancer [2-4]. Under conditions of severe surgical stress, muscle breakdown and lipolysis are promoted to accelerate wound healing and support host defense against infection. Without adequate nutritional support, patients rapidly lose substantial amounts of muscle mass [10]. However, as endogenous energy is initially supplied by muscle breakdown and lipolysis immediately following surgery, exogenous nutrition may temporarily result in a relative energy excess. The physiological shift from protein degradation to protein synthesis typically occurs around POD 3–4 [11].
To reduce muscle protein breakdown, it is necessary both to minimize surgical trauma and provide appropriate nutrition therapy. Our minimally invasive esophagectomy procedure, RA-TME, reduces surgical stress. This technique is especially beneficial for patients with respiratory diseases, as its nontransthoracic approach enables esophagectomy without the need for ventilator management or regular bronchoscopic suction. Nevertheless, we may have overestimated the benefits of this procedure and gradually paid less attention to postoperative nutrition therapy. Despite the use of minimally invasive surgery, we observed that most patients experienced substantial PBWL. Notably, PBWL at 2 weeks postoperatively was significantly lower in the AA(+) group compared to the AA(–) group. This finding underscores the importance of postoperative nutritional therapy, even after minimally invasive surgery. The lack of significant difference in PBWL at one week may reflect ongoing muscle breakdown, while PBWL at 4 weeks could be influenced by oral intake after discharge.
The AA(+) group also received more total kilocalories and more energy from fat than the AA(–) group. It is well established that carbohydrate administration exerts a protein-sparing effect. Fat provides a substantial source of energy and may also reduce muscle protein breakdown to some extent, though the effect is less pronounced. These observations suggest that the benefits observed in the AA(+) group may have been derived not only from amino acids, but also from additional carbohydrate, fat, and overall energy intake.
It is also important to consider that a higher proportion of patients in the AA(–) group underwent three-field lymphadenectomy compared to the AA(+) group. Three-field lymphadenectomy may increase surgical stress and, consequently, result in greater PBWL.
This study has several limitations. First, it was a retrospective analysis conducted at a single institution, and unmeasured confounding factors may have influenced the results. Second, the number of patients with body composition measurements at 4 weeks was relatively small, as no first postoperative visit was routinely scheduled at this time point.
Although amino acid administration did not have a marked effect on the incidence of postoperative complications, its provision reduced PBWL following RA-TME. Even after minimally invasive esophagectomy, PN containing amino acids should be considered. Future studies should investigate the effects of early EN, PN with amino acids and lipids, combined EN and PN, and special nutrients that modulate host response on PBWL and clinical outcomes.
Authors’ contribution
Conceptualization: TN, KF, SM, RI, KK, MN, NM. Data curation: TN. Formal analysis: TN. Investigation: TN. Methodology: TN. Project administration: TN. Resources: TN. Software: TN. Supervision: KF. Validation: TN, KF, IR, KK. Visualization: TN. Writing–original draft: TN. Writing–review & editing: TN, KF, SM, RI, KK, MN, NM, SY, KY, YB. All authors read and approved the final manuscript.
Conflict of interest
Contact the corresponding author for research data availability.
Funding
None.
Data availability
Data files are available from Harvard Dataverse: https://doi.org/10.7910/DVN/G6M5ZS
Acknowledgments
None.
Supplementary materials
Supplementary materials can be found via https://doi.org/10.15747/ACNM.25.0012
Fig. 1.
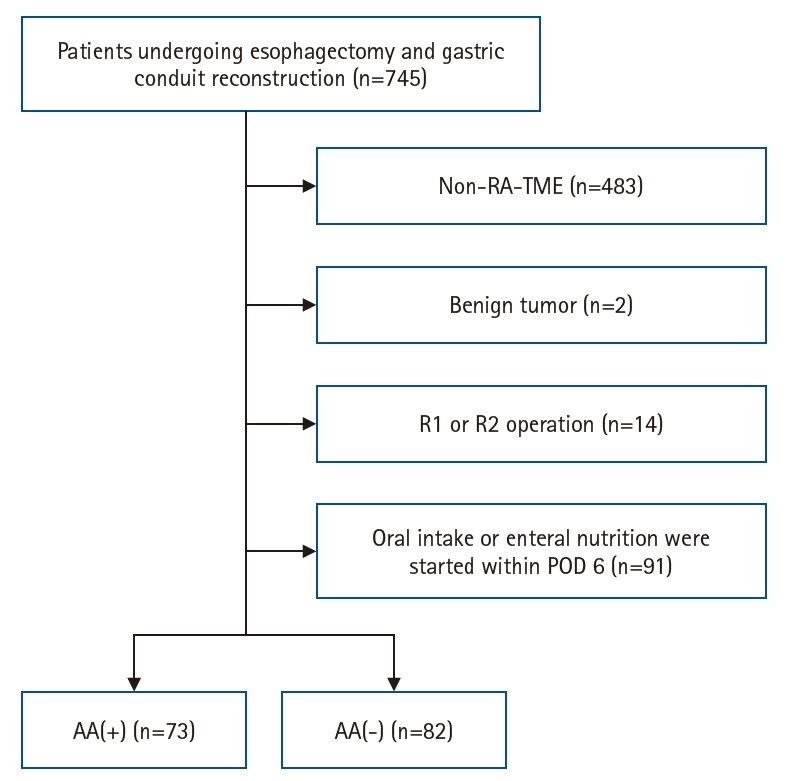
Flowchart of patient enrollment. RA-TME, robot-assisted radical transmediastinal esophagectomy; POD, postoperative day; AA(+), intravenous amino acids administered by POD 6; AA(–), no amino acids administered.
Fig. 2.
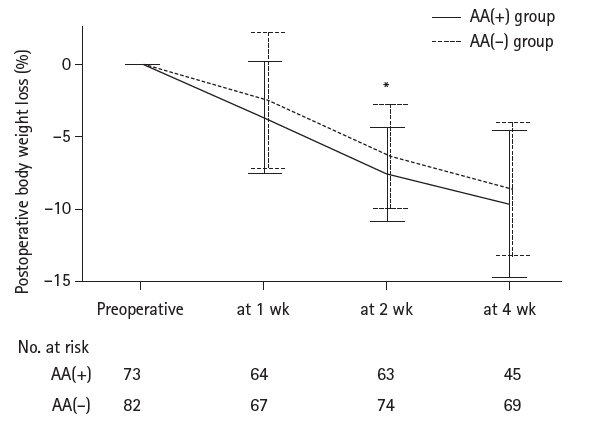
Postoperative body weight change. Mean percentage change±standard deviaiton in body weight from baseline over time in the AA(+) and AA(–) groups. AA(+), intravenous amino acids administered by postoperative day 6; AA(–), no amino acids administered. *P-values <0.05 between two groups (linear mixed-effects models).
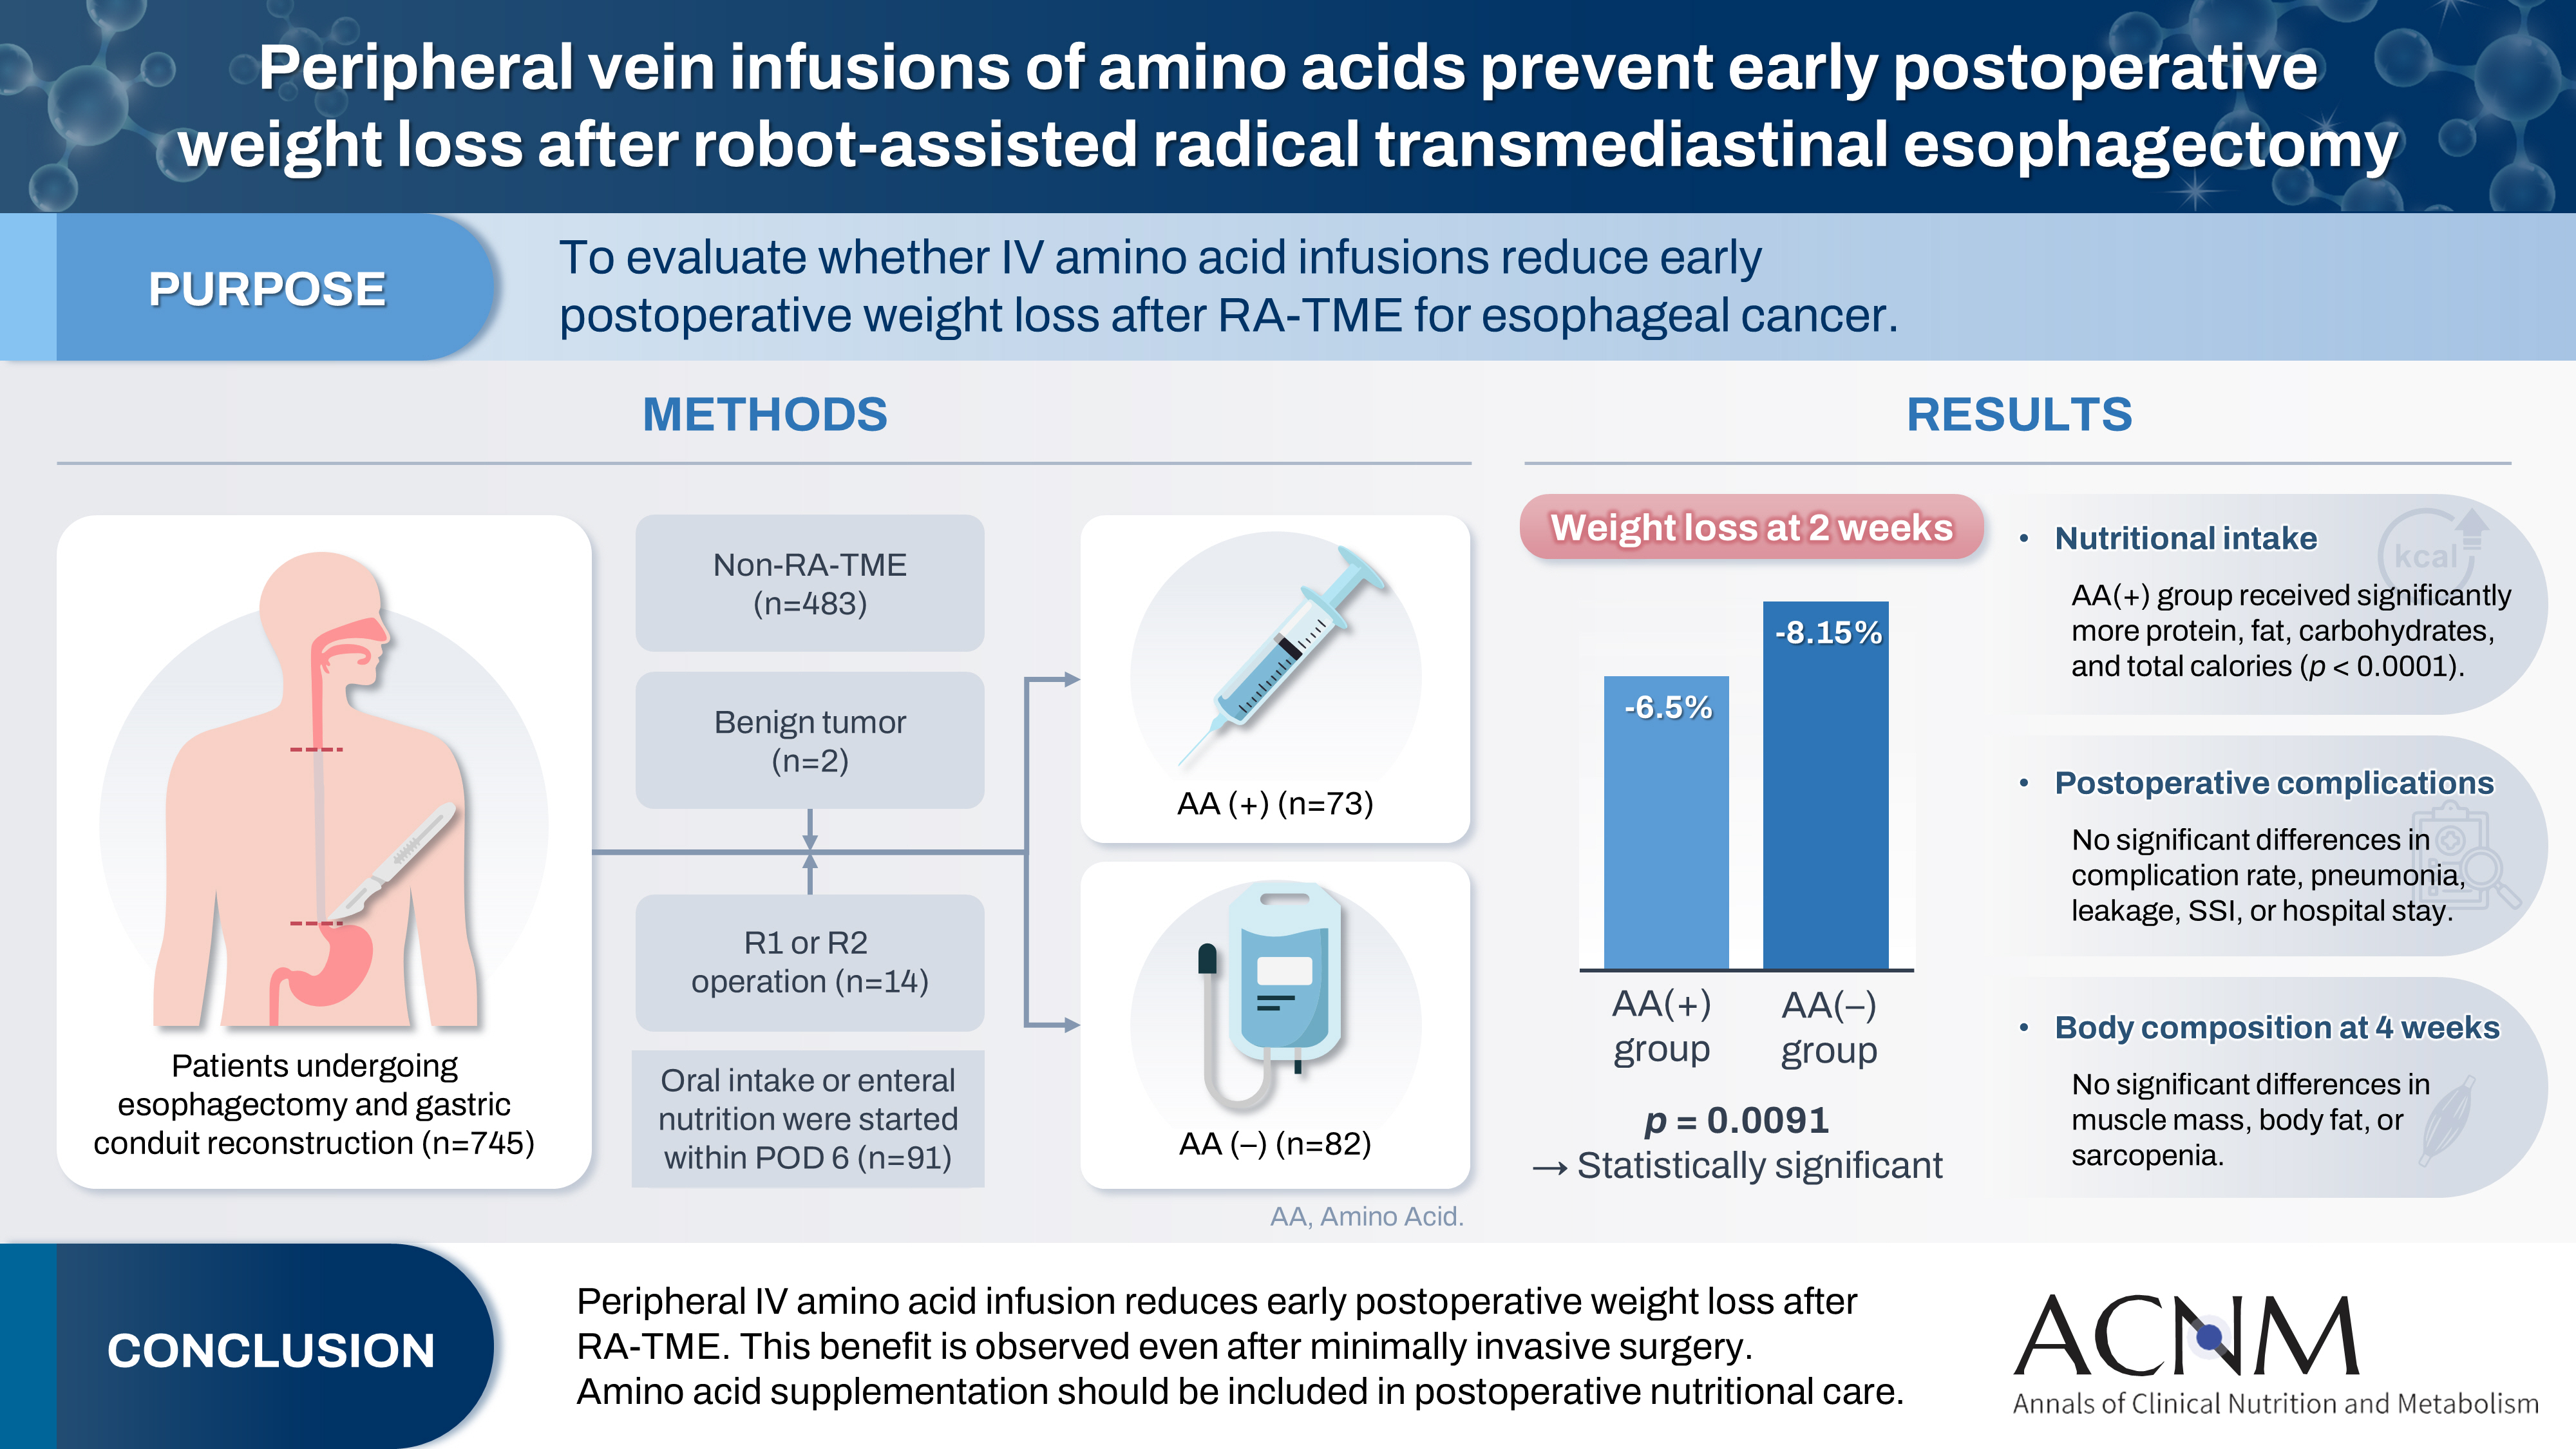
Table 1.
Patients’ characteristics
Values are presented as number (%) or median (interquartile range).
AA(+), intravenous amino acids administered by postoperative day 6; AA(–), no amino acids administered; BMI, body mass index; SPPB, Short Physical Performance Battery; SMI, skeletal muscle index; ASA-PS, American Society of Anesthesiologists physical status; AST, aspartate aminotransferase; ALT, alanine aminotransferase; γ-GTP, γ-glutamyl transpeptidase; CRP, C-reactive protein; NLR, neutrophil-to-lymphocyte ratio; PLR, platelet to lymphocyte ratio; PNI, prognostic nutritional index.
aSPPB scores include missing values.
Table 2.
Surgical outcomes
Table 3.
Postoperative nutrition components
Table 4.
Postoperative short-term and pathological outcomes
Table 5.
Body composition parameters at 4 weeks after surgery
- 1. Sung H, Ferlay J, Siegel RL, Laversanne M, Soerjomataram I, Jemal A, et al. Global cancer statistics 2020: GLOBOCAN estimates of incidence and mortality worldwide for 36 cancers in 185 countries. CA Cancer J Clin 2021;71:209-49. ArticlePubMedPDF
- 2. Koterazawa Y, Oshikiri T, Takiguchi G, Urakawa N, Hasegawa H, Yamamoto M, et al. Severe weight loss after minimally invasive oesophagectomy is associated with poor survival in patients with oesophageal cancer at 5 years. BMC Gastroenterol 2020;20:407.ArticlePubMedPMCPDF
- 3. Kubo Y, Miyata H, Sugimura K, Shinno N, Asukai K, Hasegawa S, et al. Prognostic implication of postoperative weight loss after esophagectomy for esophageal squamous cell cancer. Ann Surg Oncol 2021;28:184-93. ArticlePubMedPDF
- 4. Yamamoto K, Tanaka K, Yamasaki M, Yamashita K, Makino T, Saito T, et al. Early postoperative weight loss is associated with poor prognosis in patients with esophageal cancer. Esophagus 2022;19:596-603. ArticlePubMedPDF
- 5. Mori K, Yamagata Y, Aikou S, Nishida M, Kiyokawa T, Yagi K, et al. Short-term outcomes of robotic radical esophagectomy for esophageal cancer by a nontransthoracic approach compared with conventional transthoracic surgery. Dis Esophagus 2016;29:429-34. ArticlePubMedPMCPDF
- 6. Yoshimura S, Mori K, Yamagata Y, Aikou S, Yagi K, Nishida M, et al. Quality of life after robot-assisted transmediastinal radical surgery for esophageal cancer. Surg Endosc 2018;32:2249-54. ArticlePubMedPMCPDF
- 7. Mori K, Yamagata Y, Wada I, Shimizu N, Nomura S, Seto Y, et al. Robotic-assisted totally transhiatal lymphadenectomy in the middle mediastinum for esophageal cancer. J Robot Surg 2013;7:385-7. ArticlePubMedPMCPDF
- 8. Brierley JD, Gospodarowicz MK, Wittekind C. TNM classification of malignant tumours. 8th ed. John Wiley & Sons; 2017.
- 9. Dindo D, Demartines N, Clavien PA. Classification of surgical complications: a new proposal with evaluation in a cohort of 6336 patients and results of a survey. Ann Surg 2004;240:205-13. PubMedPMC
- 10. Fukatsu K. Role of nutrition in gastroenterological surgery. Ann Gastroenterol Surg 2019;3:160-8. ArticlePubMedPMCPDF
- 11. Konosu M, Iwaya T, Kimura Y, Akiyama Y, Shioi Y, Endo F, et al. Peripheral vein infusions of amino acids facilitate recovery after esophagectomy for esophageal cancer: retrospective cohort analysis. Ann Med Surg (Lond) 2017;14:29-35. ArticlePubMedPMC
References
Figure & Data
REFERENCES
Citations
Citations to this article as recorded by 
 Cite
CitePeripheral vein infusions of amino acids prevent early postoperative weight loss after robot-assisted radical transmediastinal esophagectomy: a retrospective study in Japan


Fig. 1. Flowchart of patient enrollment. RA-TME, robot-assisted radical transmediastinal esophagectomy; POD, postoperative day; AA(+), intravenous amino acids administered by POD 6; AA(–), no amino acids administered.
Fig. 2. Postoperative body weight change. Mean percentage change±standard deviaiton in body weight from baseline over time in the AA(+) and AA(–) groups. AA(+), intravenous amino acids administered by postoperative day 6; AA(–), no amino acids administered. *P-values <0.05 between two groups (linear mixed-effects models).
Graphical abstract
Fig. 1.
Fig. 2.
Graphical abstract
Peripheral vein infusions of amino acids prevent early postoperative weight loss after robot-assisted radical transmediastinal esophagectomy: a retrospective study in Japan
| Characteristic | AA(+) group (n=73) | AA(–) group (n=82) | P-value |
|---|---|---|---|
| Sex | 0.1516 | ||
| Male | 59 (80.82) | 73 (89.02) | |
| Female | 14 (19.18) | 9 (10.98) | |
| Age (yr) | 68 (60–74) | 68 (61–72) | 0.9143 |
| ≥75 yr | 15 (19.35) | 15 (20.55) | 0.7228 |
| Height (cm) | 165.2 (160.3–169.6) | 166.6 (162.4–171) | 0.1500 |
| Body weight (kg) | 60.3 (53.8–66.0) | 61.9 (53.6–68.8) | 0.4801 |
| BMI (kg/m2) | 21.8 (19.7–24.2) | 21.7 (20.2–23.7) | 0.7592 |
| Obese (BMI ≥25 kg/m2) | 10 (13.70) | 13 (15.85) | 0.7064 |
| Underweight (BMI ≤18.5 kg/m2) | 11 (15.07) | 10 (12.20) | 0.6018 |
| Muscle mass (kg) | 45.1 (37.1–48.1) | 46.5 (42.1–49.9) | 0.1016 |
| Body fat percentage (%) | 16.7 (14.7–22.6) | 20.0 (16.1–24.1) | 0.0940 |
| SPPB score (point) | 12 (12–12) | 12 (11–12) | 0.2642 |
| SPPB scorea | 0.9064 | ||
| ≤9 points | 2 (4.00) | 2 (2.70) | |
| ≥10 points | 48 (96.00) | 72 (97.30) | |
| SMI (kg/m2) | 7.15 (6.05–7.78) | 7.50 (6.80–8.10) | 0.0447 |
| Low SMI | 10 (35.71) | 22 (22.00) | 0.1385 |
| Sarcopenia | 7 (25.00) | 13 (13.00) | 0.1222 |
| Preoperative chemotherapy | 34 (46.58) | 46 (56.10) | 0.2364 |
| ASA-PS classification | 0.3710 | ||
| 1 or 2 | 68 (93.15) | 73 (89.02) | |
| ≥3 | 5 (6.85) | 9 (10.98) | |
| White blood cells, (/μL) | 6,500 (5,250–8,050) | 6,200 (4,900–7,625) | 0.2869 |
| Neutrophils (/μL) | 4,340 (3,247–5,954) | 4,085 (3,196–5,104) | 0.0713 |
| Lymphocytes (/μL) | 1,342 (1,129–1,584) | 1,488 (1,223–1,773) | 0.1440 |
| Hemoglobin (g/dL) | 12.4 (10.3–13.7) | 12.0 (10.7–13.8) | 0.8269 |
| Platelets (×104/μL) | 25.2 (21.6–29.7) | 24.7 (19.4–30.5) | 0.5554 |
| Serum albumin (mg/dL) | 3.9 (3.7–4.2) | 3.9 (3.6–4.2) | 0.7749 |
| AST (U/L) | 19.0 (16.0–22.0) | 20.0 (16.0–22.3) | 0.7531 |
| ALT (U/L) | 14.0 (11.0–17.0) | 13.0 (10.0–19.3) | 0.9871 |
| γ-GTP (U/L) | 29 (21–41) | 26 (20–37) | 0.3431 |
| Total bilirubin (mg/dL) | 0.5 (0.4–0.7) | 0.6 (0.4–0.7) | 0.5849 |
| CRP (mg/dL) | 0.07 (0.03–0.25) | 0.07 (0.04–0.19) | 0.9141 |
| NLR | 3.1 (2.4–4.8) | 2.7 (2.1–4.0) | 0.0161 |
| PLR | 195.2 (144.7–254.4) | 155.0 (126.1–235.5) | 0.0987 |
| PNI | 46.4 (43.5–48.8) | 47.0 (43.4–49.0) | 0.5164 |
| AA(+) group (n=73) | AA(–) group (n=82) | P-value | |
|---|---|---|---|
| Operative time (min) | 429.0 (372.0–478.5) | 430.5 (381.5–478.3) | 0.7348 |
| Intraoperative blood loss (mL) | 180.0 (80.0–290.0) | 180.0 (87.5–386.3) | 0.4568 |
| Lymphadenectomy | 0.0013 | ||
| Three-field | 51 (69.86) | 74 (90.24) | |
| Two-field | 22 (30.14) | 8 (9.76) | |
| Reconstruction route | 0.5858 | ||
| Posterior mediastinal route | 69 (84.52) | 79 (96.34) | |
| Non-posterior mediastinal route | 4 (5.48) | 3 (3.66) |
| AA(+) group (n=73) | AA(–) group (n=82) | P-value | |
|---|---|---|---|
| Amounts on POD 6 | |||
| Protein and AA (g) | 45.0 (45.0–60.0) | 0 (0–0) | <0.0001 |
| Fat (g) | 0 (0–21.2) | 0 (0–0) | <0.0001 |
| Carbohydrates (g) | 150.0 (112.5–152.2) | 86.0 (64.5–86.0) | <0.0001 |
| Energy (kcal) | 840 (630–1,040) | 344 (258–344) | <0.0001 |
| Total amounts for POD 1-6 | |||
| Protein and AA (g) | 150.0 (97.5–195.0) | 0 (0–0) | <0.0001 |
| Fat (g) | 0 (0–63.6) | 0 (0–0) | <0.0001 |
| Carbohydrates (g) | 643.5 (577.5–775.9) | 521.3 (448.3–545.4) | <0.0001 |
| Energy (kcal) | 3,350 (2,898–4,336) | 2,092 (1,824–2,210) | <0.0001 |
| PN (mL) | 13,620 (12,370–14,720) | 13,250 (12,075–14,590) | 0.4890 |
| Total amounts for POD 1-14 | |||
| Protein and AA (g) | 561.0 (488.8–642.1) | 250.4 (184.6–336.2) | <0.0001 |
| Fat (g) | 163.0 (105.9–251.1) | 107.8 (72.4–131.7) | <0.0001 |
| Carbohydrates (g) | 1,966 (1,742–2,221) | 1,647 (1,457–1,803) | <0.0001 |
| Energy (kcal) | 12,151 (10,371–12,889) | 8,436 (7,605–9,686) | <0.0001 |
| PN (mL) | 23,680 (19,880–27,535) | 22,325 (19,163–27,363) | 0.1272 |
| AA(+) group (n=73) | AA(–) group (n=82) | P-value | |
|---|---|---|---|
| Postoperative complications with CD ≥2 | 41 (56.16) | 47 (57.32) | 0.885 |
| Postoperative complications with CD ≥3 | 24 (32.88) | 17 (20.73) | 0.0871 |
| Pneumonia | 14 (19.18) | 11 (13.41) | 0.3302 |
| Anastomotic leakage | 11 (15.07) | 16 (19.51) | 0.4666 |
| Superficial surgical site infection | 4 (5.48) | 5 (6.10) | 0.8695 |
| Postoperative hospitalization (day) | 21 (17–31) | 18 (17–26) | 0.4564 |
| Pathological T factor | 0.0722 | ||
| pT1 or 2 | 56 (76.71) | 52 (63.41) | |
| pT3 or 4 | 17 (23.29) | 30 (36.59) | |
| Lymph node metastasis | 0.4776 | ||
| Presence | 38 (52.05) | 38 (46.34) | |
| Absence | 35 (47.95) | 44 (53.66) |
| AA(+) group (n=45) | AA(–) group (n=69) | P-value | |
|---|---|---|---|
| Muscle mass (kg) | 42.6 (35.7–46.7) | 43.9 (39.9–46.8) | 0.2943 |
| Muscle mass loss (kg) | 1.6 (0.7–3.4) | 2.8 (1.5–4.4) | 0.1148 |
| Muscle mass loss change (%) | 4.4 (1.8–7.6) | 5.9 (3.2–9.3) | 0.1893 |
| Body fat percentage (%) | 18.5 (14.7–20.8) | 16.1 (13.4–20.1) | 0.1823 |
| Body fat percentage change (%) | 2.9 (1.1–3.6) | 2.0 (1.1–3.4) | 0.4283 |
| SPPB score (point) | 12 (11–12) | 12 (11–12) | 0.7922 |
| Low SPPB scorea | 0.1676 | ||
| ≤9 points | 5 (12.50) | 3 (4.92) | |
| ≥10 points | 35 (87.50) | 58 (95.08) | |
| SMI (kg/m2) | 6.7 (6.0–7.2) | 7.0 (6.0–7.0) | 0.6764 |
| Low SMI | 26 (57.78) | 35 (50.72) | 0.3843 |
| Sarcopenia | 19 (42.22) | 23 (33.33) | 0.3362 |
Table 1. Patients’ characteristics
Values are presented as number (%) or median (interquartile range). AA(+), intravenous amino acids administered by postoperative day 6; AA(–), no amino acids administered; BMI, body mass index; SPPB, Short Physical Performance Battery; SMI, skeletal muscle index; ASA-PS, American Society of Anesthesiologists physical status; AST, aspartate aminotransferase; ALT, alanine aminotransferase; γ-GTP, γ-glutamyl transpeptidase; CRP, C-reactive protein; NLR, neutrophil-to-lymphocyte ratio; PLR, platelet to lymphocyte ratio; PNI, prognostic nutritional index. aSPPB scores include missing values.
Table 2. Surgical outcomes
Values are presented as median (interquartile range) or number (%). AA(+), intravenous amino acids administered by postoperative day 6; AA(–), no amino acids administered.
Table 3. Postoperative nutrition components
Values are presented as median (interquartile range). AA(+), intravenous amino acids administered by POD 6; AA(–), no amino acids administered; POD, postoperative day; AA, amino acid; PN, parenteral nutrition.
Table 4. Postoperative short-term and pathological outcomes
Values are presented as number (%) or median (interquartile range). AA(+), intravenous amino acids administered by postoperative day 6; AA(–), no amino acids administered; CD, Clavien-Dindo classification.
Table 5. Body composition parameters at 4 weeks after surgery
Values are presented as median (interquartile range) or number (%). AA(+), intravenous amino acids administered by postoperative day 6; AA(–), no amino acids administered; SPPB, Short Physical Performance Battery; SMI, skeletal muscle index. aSPPB scores include missing values.

